
Author: David I. Templeton, CFA, Principal and Portfolio Manager
With the month of February coming to an end this week, a majority of 2024 is still before us. As the year began, many strategists predicted up to six Fed Fund rate cuts by the Federal Reserve. The first cut was anticipated to occur in March but economic data and Federal Reserve commentary has pushed the anticipated first rate cut to June. What is influencing the delay in rate cuts is the fact the economy is doing better than many had anticipated and inflation is a little stickier than expected.
The Fed's dual mandate is that of maintaining stable prices and maximizing employment. The stable prices mandate had a setback a few weeks ago when inflation was reported higher than expected at 3.1%. The Fed's preferred inflation measure is the Personal Consumption Expenditures Price Index (PCE) and will be reported Wednesday. The Fed's target for Core PCE is 2.0%.
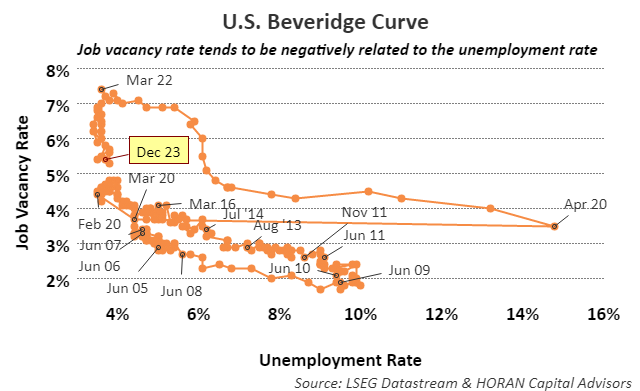
With respect to employment the unemployment rate remains at a low level of 3.7% in spite of the rapid increase in short term rates that the Fed pursued from 2022 to mid-year 2023. One would expect the tighter monetary policy to slow economic growth and likely result in a higher unemployment rate which has not occurred. One graphical way to look at this is to evaluate the unemployment rate versus the level of job openings. A common measure to do this is known as the Beveridge Curve, named after the British economist William Henry Beveridge. When there is a mismatch between available jobs and the unemployment level, the curve shifts outward and up to the right. Following the pandemic this was what unfolded as many service jobs were lost and higher skilled technology jobs grew as businesses were closed. However, if one looks from April 2020 to March 2022 employment recovered. Then from March 2022 when the Fed began increasing interest rates the Fed had the benefit of a high level of job vacancies and job vacancies declined while the unemployment level remained steady. So instead of companies reducing employment vacancies declined partly due to a higher employment level but partly due to a reduction in job openings.
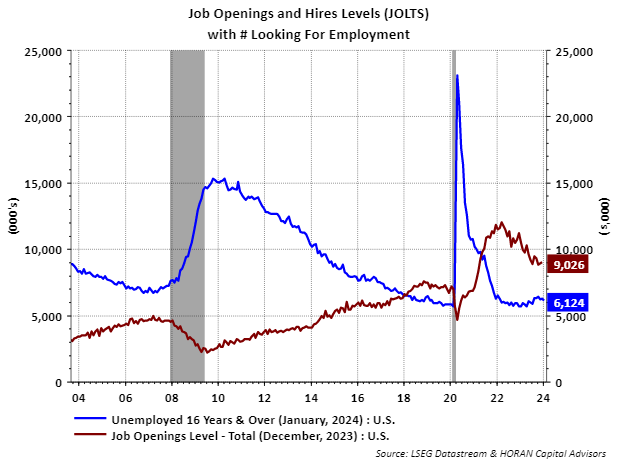
Another way to see this is to look at the job openings versus the number of individuals unemployed. As the below chart shows, the number of open positions has declined since early 2023 while the number of individuals unemployed remains near the level reached pre-pandemic.
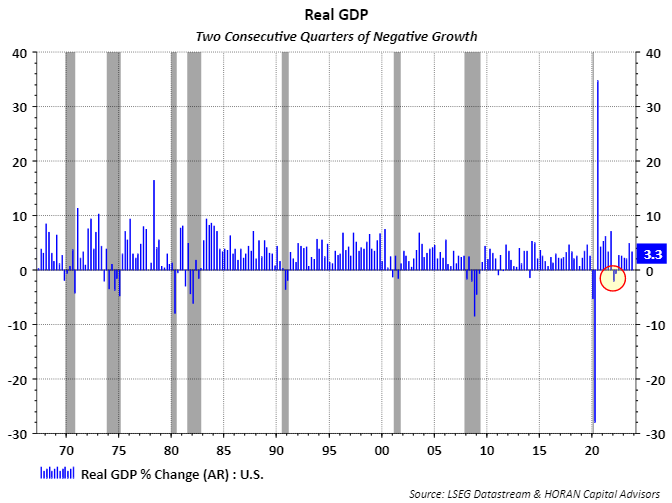
At HORAN we wrote in several of our quarterly investor letters in late 2022 and early 2023 that the U.S economy did experience a recession in early 2022 when real GDP was negative for two consecutive quarters. NBER establishes the start and end of recession periods and they have a more nuanced recession definition. Nonetheless, two consecutive quarters of negative GDP is often understood to signify a recession. As the below chart shows, going back to the late 1960's anytime two consecutive quarters of negative GDP growth was experienced, a recession was noted by NBER (grey shading.)
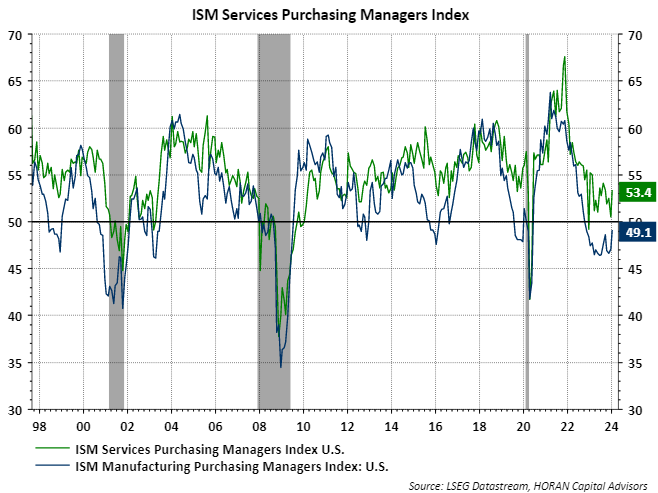
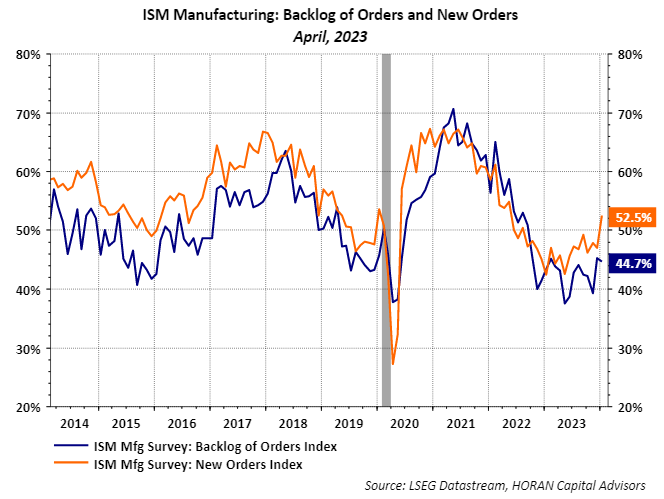
The Institute for Supply Management (ISM) conducts monthly surveys for the manufacturing and service sectors of the economy. The services industries represent more than 70% of GDP and a reading above 50% indicates a service sector that is expanding. As the below chart shows the ISM Services Purchasing Managers Index (PMI) came in at 53.4% in December. The ISM Manufacturing PMI was reported at 49.1%, a contractionary level. However, ISM notes, "a Manufacturing PMI® above 42.5%, over a period of time, generally indicates an expansion of the overall economy."
Finally, where backlogs were significant following the pandemic, the blue line on the below chart shows much of the backlog has been reduced to a more normal level as supply chain issues have resolved. Also, new orders have been trending higher for most of 2023.
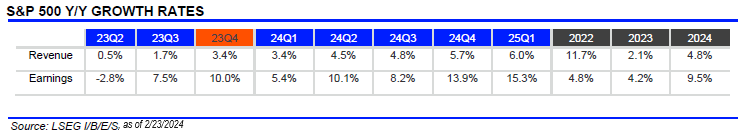
So, with all the talk about a recession, both hard and soft data suggests an economic environment that is growing at a pace that is not too fast. The unemployment rate remains at a low 3.7%, jobless claims reported last week equaled 201,000 which was lower than the estimate of 218,000. From an earnings perspective, fourth quarter earnings season is almost complete. A total of 448 companies in the S&P 500 Index have reported earnings to date. The year over year earnings growth rate is expected to equal 10% for Q4 2023. At the end of 2023 the Q4 earnings growth estimate was only 5.2% and all of 2024 earnings growth is expected to equal near a double-digit rate at 9.5%. Certainly there are potential headwinds that can be cited: an inverted yield curve, a steeply negative Leading Economic Indicators Index and more; but more of the data seems supportive of a soft landing, if not already landed.
HORAN Wealth, LLC is an SEC registered investment advisor. The information herein has been obtained from sources believed to be reliable, but we cannot assure its accuracy or completeness. Neither the information nor any opinion expressed constitutes a solicitation for the purchase or sale of any security. Any reference to past performance is not to be implied or construed as a guarantee of future results. Market conditions can vary widely over time and there is always the potential of losing money when investing in securities. HORAN Wealth and its affiliates do not provide tax, legal or accounting advice. This material has been prepared for informational purposes only, and is not intended to provide, and should not be relied on for tax, legal or accounting advice. You should consult your own tax, legal and accounting advisors before engaging in any transaction. For further information about HORAN Wealth, LLC, please see our Client Relationship Summary at adviserinfo.sec.gov/firm/summary/333974.