
Author: David I. Templeton, CFA, Principal and Portfolio Manager
Sunday afternoon President Joe Biden announced he would not seek reelection to a second term as President although the democratic primary season has mostly passed. I will leave the political implication of this to the political pundits, but investors might be curious about the potential impact this type of announcement might have on market returns. An issue the market will need to digest is the uncertainty this creates as markets do not like uncertainty. In short then, one might expect the equity market to experience a bit higher volatility in the coming weeks, but longer term, and we express this to our clients, politics is one factor that has minimal longer-term influence on the market's direction. In short, companies and investors will adjust to new policies that are enacted by different administrations.
In the short run though the market can react differently under varying dynamics in presidential election years. Carson Investment Research published the below chart prior to today's announcement, and it shows there is a pattern to the market's returns if the president is running for reelection or not. The orange line in the below chart shows the trend of the market if the president is running for reelection and the blue line is the market pattern in a lame duck presidential year.
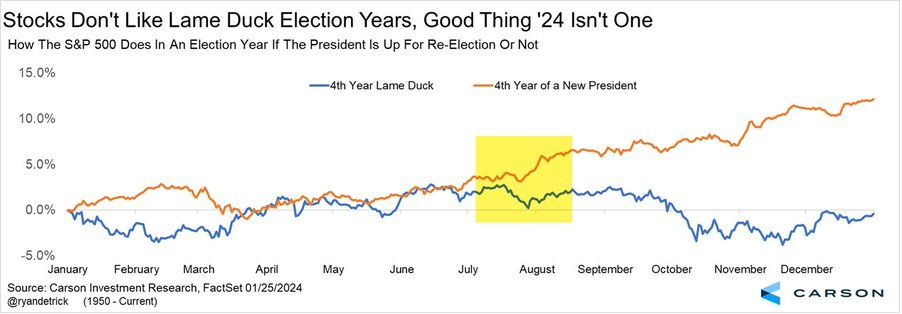
With the strength of the equity market in the first seven months of this year, the orange line seems to be representative of the market's pattern. However, with the president now not seeking reelection, might the blue line be the probable direction of the market for the balance of this year?
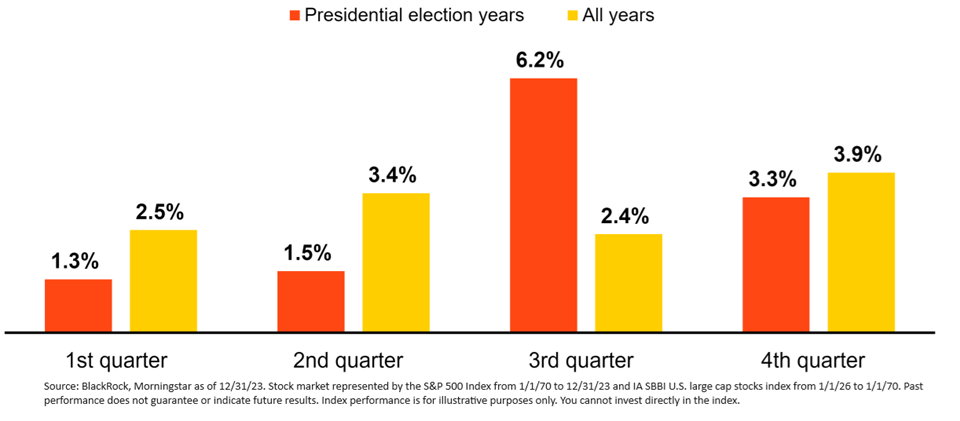
A lot of data like election year data can depend on the time frame chosen for the evaluation period and the above chart has data back to 1950. Below is a chart that goes back to 1926 showing the market's return by quarter in presidential election years (orange bars) and in all years (yellow bars.) In short, regardless of whether the current president is or is not running for reelection, the equity market is strongest in the third and fourth quarters of presidential election years.
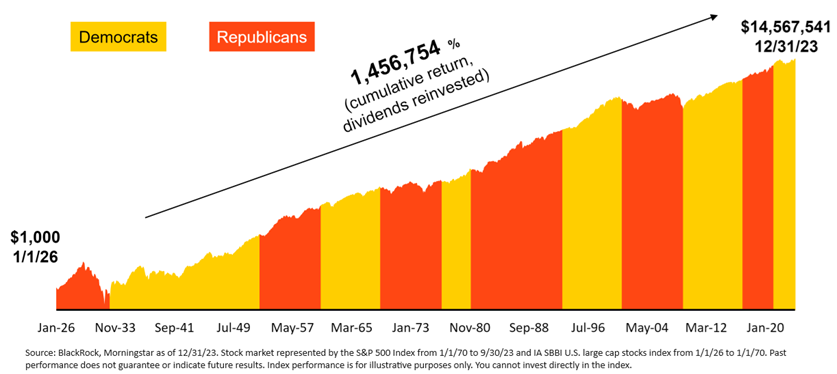
In conclusion, investors should not overreact to this political news as it relates to one's investment portfolio. As the below chart shows, over time, the equity market has a bias to the upside and timing in and out of it can be a difficult endeavor. Certainly, near term volatility might be elevated, but companies and investors will adjust to any new administration.
HORAN Wealth, LLC is an SEC registered investment advisor. The information herein has been obtained from sources believed to be reliable, but we cannot assure its accuracy or completeness. Neither the information nor any opinion expressed constitutes a solicitation for the purchase or sale of any security. Any reference to past performance is not to be implied or construed as a guarantee of future results. Market conditions can vary widely over time and there is always the potential of losing money when investing in securities. HORAN Wealth and its affiliates do not provide tax, legal or accounting advice. This material has been prepared for informational purposes only, and is not intended to provide, and should not be relied on for tax, legal or accounting advice. You should consult your own tax, legal and accounting advisors before engaging in any transaction. For further information about HORAN Wealth, LLC, please see our Client Relationship Summary at adviserinfo.sec.gov/firm/summary/333974.