
Author: David I. Templeton, CFA, Principal and Portfolio Manager
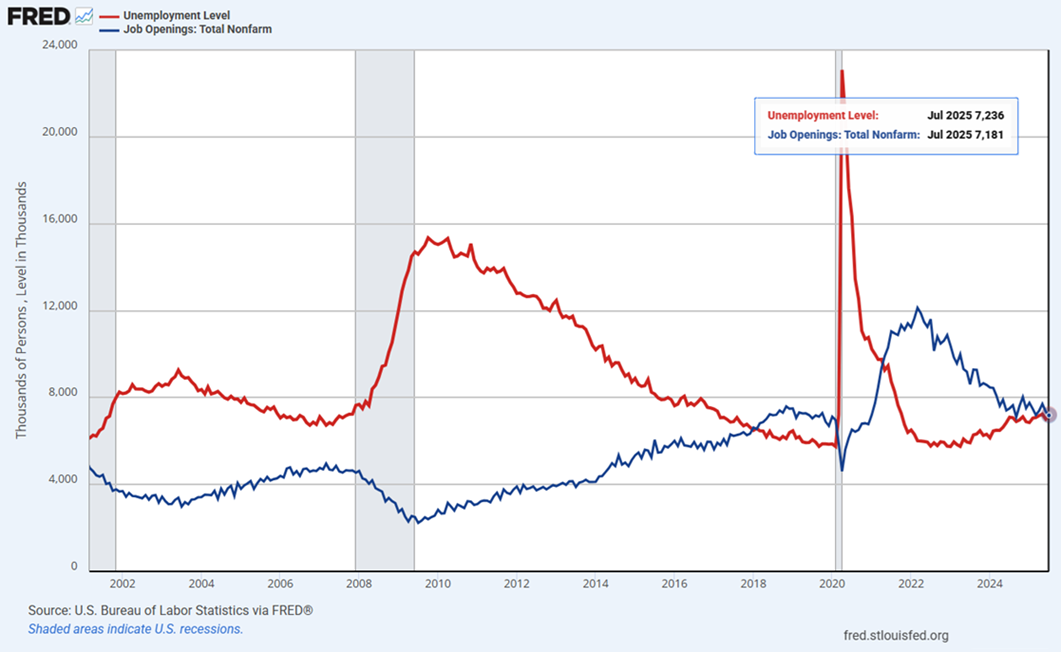
Today's release of the Job Openings and Labor Turnover Survey (JOLTS) provided additional insight that suggests the employment market is weakening. The report shows Job Openings of 7.18 million is now lower the number of unemployed individuals or 7.24 million. The last occurrence where the job openings level feel below the number of unemployed was during the Covid recession in 2020.
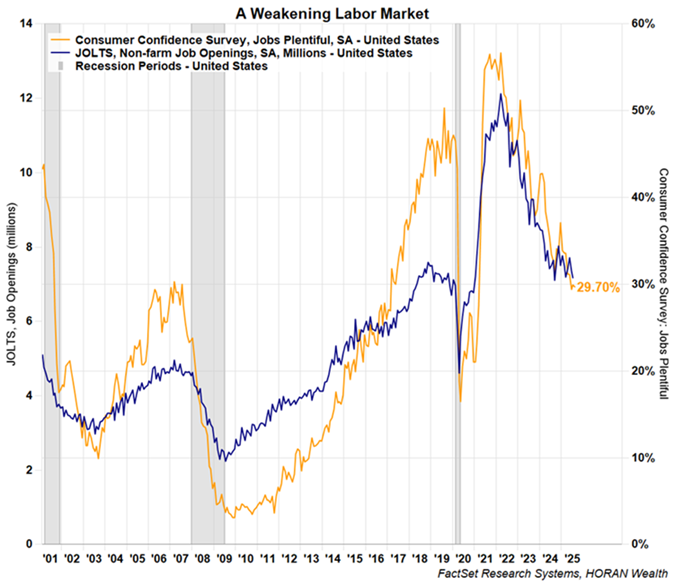
In the Conference Board's Consumer Confidence Survey reported last week, 29.7% of consumers indicated jobs were "plentiful" down almost 2 points from July. This view by consumers has been in steady decline since its peak in March 2022 at 56.7% and coincides with the decline in job openings.
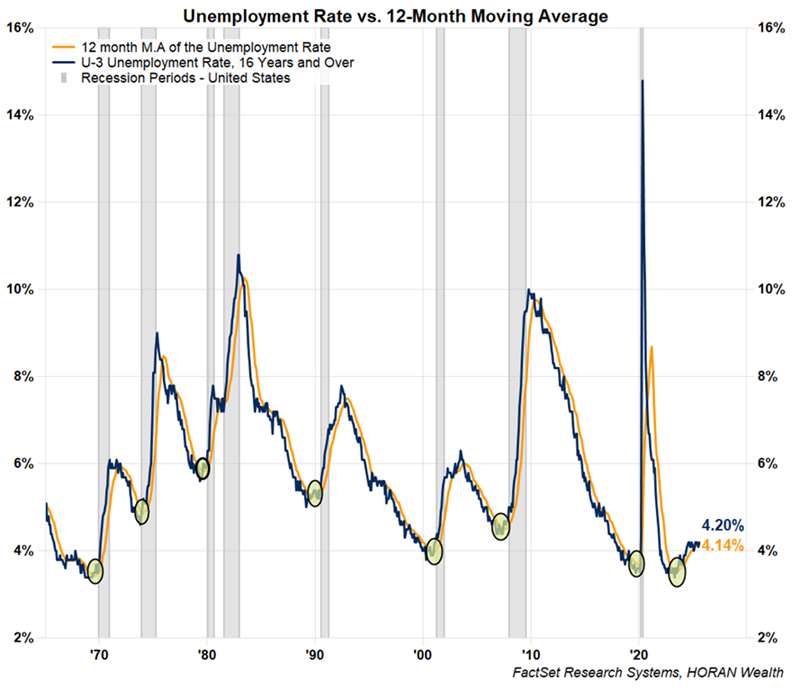
Lastly, the unemployment rate in July was reported at 4.2% and has mostly trended higher at a level above the 12-month moving average of the rate since early 2023. The yellow circles on the below chart note prior instances where the monthly rate rose above the 12-month moving average. Historically, these cross over points have occurred prior to recessions, the grey shading on the chart.
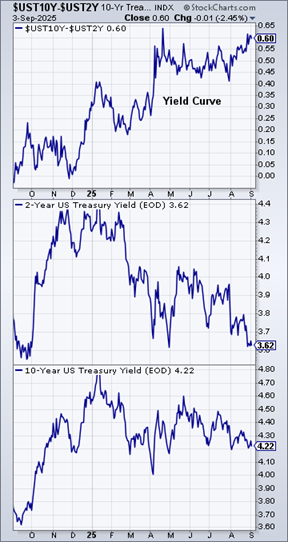
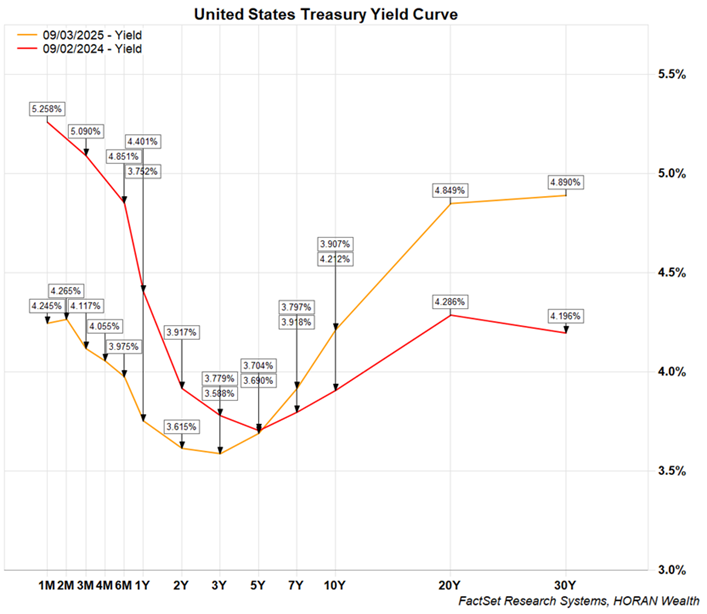
The consumer part of the economy accounts for approximately 70% of GDP. With this apparent weakening in the job market, it might be just enough information that the Fed uses to justify a quarter point rate cut later this month. The bond market is coming around to this view as well as short term rates continue to decline. Long term rates are falling at a slower pace though and longer-term rates are above the levels from a year ago, i.e. the yield curve is steepening. This steepening of the yield curve is some indication the market expects inflation to be an issue as the Fed is cutting short rates. Alternatively, where short term rates are falling faster than long term rates, known as a bull steepener, this can be a bullish indication for stocks and the economy.
HORAN Wealth, LLC is an SEC registered investment advisor. The information herein has been obtained from sources believed to be reliable, but we cannot assure its accuracy or completeness. Neither the information nor any opinion expressed constitutes a solicitation for the purchase or sale of any security. Any reference to past performance is not to be implied or construed as a guarantee of future results. Market conditions can vary widely over time and there is always the potential of losing money when investing in securities. HORAN Wealth and its affiliates do not provide tax, legal or accounting advice. This material has been prepared for informational purposes only, and is not intended to provide, and should not be relied on for tax, legal or accounting advice. You should consult your own tax, legal and accounting advisors before engaging in any transaction. For further information about HORAN Wealth, LLC, please see our Client Relationship Summary at adviserinfo.sec.gov/firm/summary/333974.