
Author: David I. Templeton, CFA, Principal and Portfolio Manager
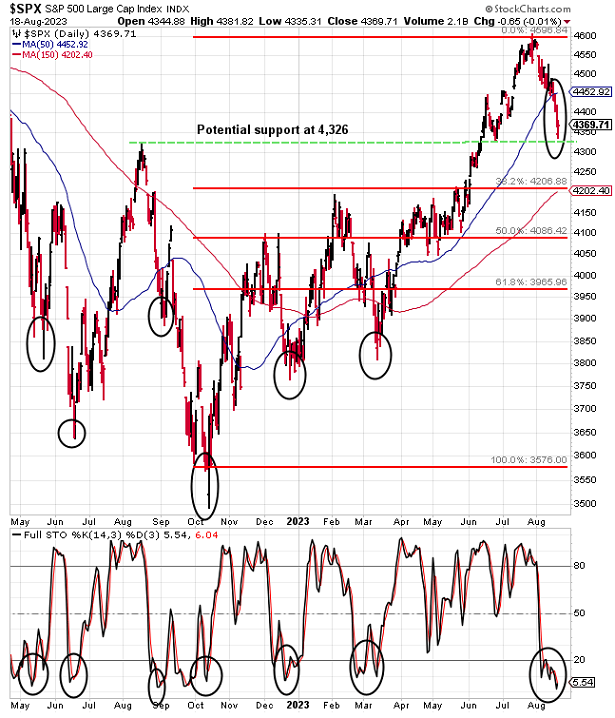
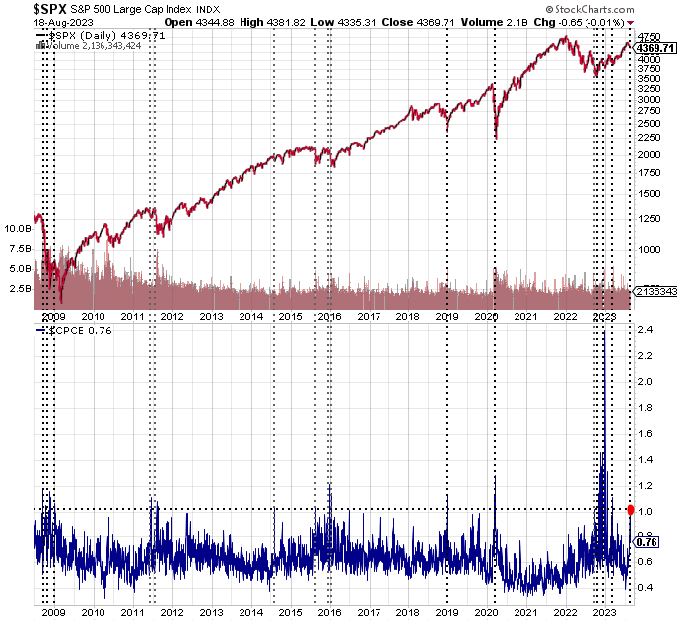
The S&P 500 Index closed at a 2023 high on July 31, but since then the market is down -4.8% in the first three weeks of August. A pullback is not a surprise and is a normal occurrence during bull market advances. Investors can expect an average year for the S&P 500 Index to experience three separate pullbacks of 5%. Before this pullback the S&P 500 Index was up 19.5% in 2023 and was up 28.3% on a price only basis since the low on October 12, 2022. More downside is possible as seen in the below chart. A next support level would be around 4,326 for the S&P 500 Index or about 1% lower from Friday's close. If this level is violated the next support level would be the 38% Fibonacci retracement level at 4,206 or about 4% lower than Friday's close of 4,369. However, the black circles on the lower chart panel are representative of an oversold market based on the Stochastics Oscillator so the market is potentially near a turning point.
In spite of the still strong returns this year, investors have shunned equities based on equity and ETF flows as seen below.
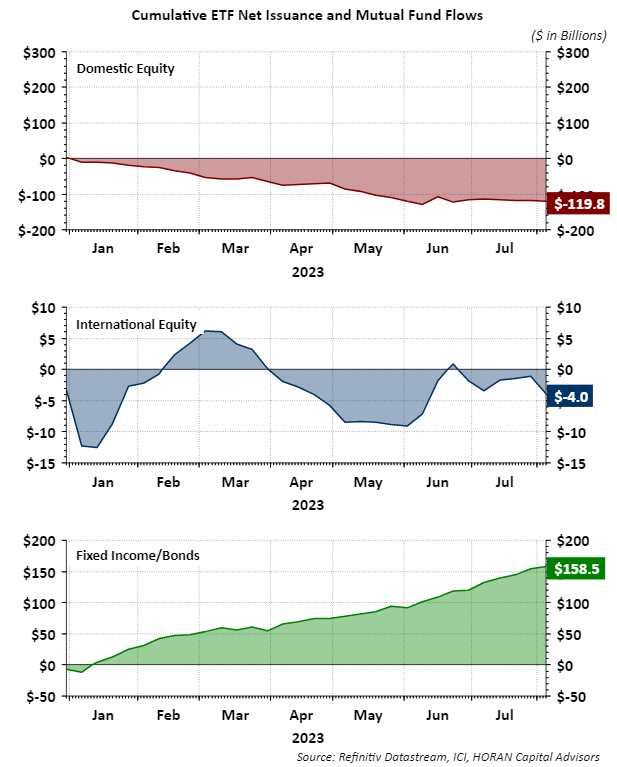
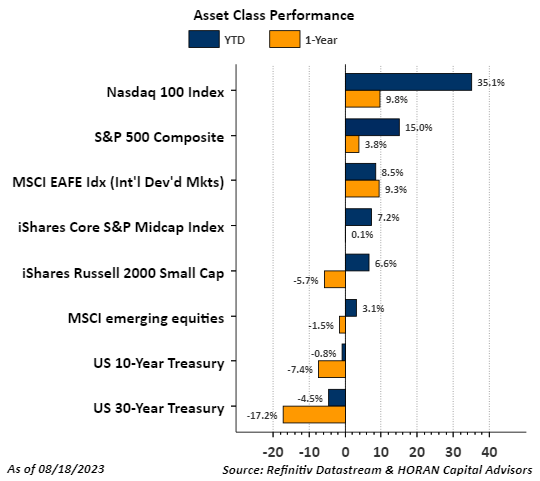
This year fund flows have favored bond or fixed income investments. The attraction of fixed income is understandable in an environment where interest rates have moved higher. The one headwind for investors in bonds though is the fact rates continue to drift higher and bond price move inversely to rates and bond prices are declining which results in a flat to negative total return for intermediate to longer term bond investments. The below bar chart lists a few asset class categories and the year to date and one year return for each respective category. Clearly, the equity asset class returns far outpace the two bond categories at the bottom of the chart. In fact, the 10- and 30-year U.S. Treasury returns are negative this year in spite of favorable income yields on the bonds.
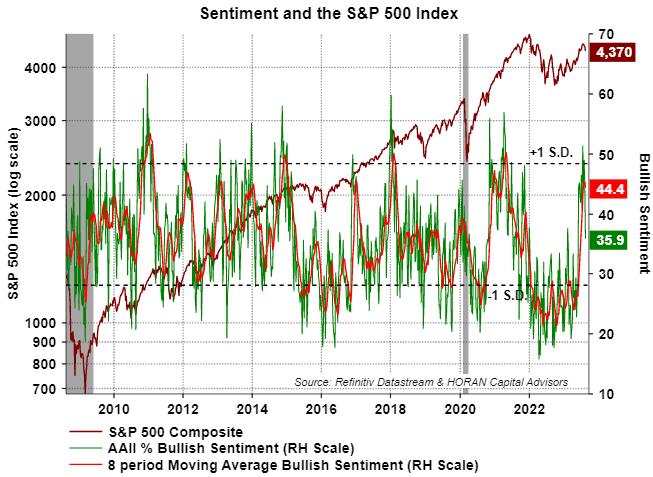
Partially in response to the favorable equity returns this years, individual investor bullish sentiment was approaching a bullish extreme as measured by the American Association of Individual Investors Sentiment Survey. Near the end of July bullish sentiment rose above 50 and into an extreme range. The sentiment measures are contrarian ones and just as individual investors became more bullish, the equity market entered its pullback.
Also, on cue was the spike in the CBOE Equity Put/Call ratio to above 1.0 to 1.03 on August 16. For investors, the equity put/call ratio measures the sentiment of investors by dividing put volume by call volume. At the extremes this particular measure is also a contrarian one; hence, P/C ratios above 1.0 signal overly bearish sentiment by investors. Higher put volume is indicative of investors purchasing downside equity market protection. When the P/C ratio is too high the market tends to reverse to the upside.
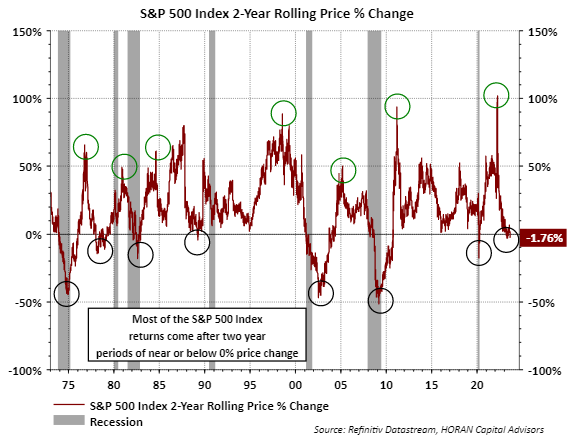
Finally, just as it is difficult to predict market tops, market bottoms are difficult to pinpoint exactly as well. Nonetheless, the equity market seems to have reached an oversold level, but of course, further lows can be reached. From a return perspective though, the market does seem to have digested the strong two-year return generated from the March 2020 Covid low to the early 2022 peak. As the below chart shows, when two-year returns are near or below zero, future returns tend to be favorable. Based on returns alone, a potentially favorable two-year return period is approaching.
HORAN Wealth, LLC is an SEC registered investment advisor. The information herein has been obtained from sources believed to be reliable, but we cannot assure its accuracy or completeness. Neither the information nor any opinion expressed constitutes a solicitation for the purchase or sale of any security. Any reference to past performance is not to be implied or construed as a guarantee of future results. Market conditions can vary widely over time and there is always the potential of losing money when investing in securities. HORAN Wealth and its affiliates do not provide tax, legal or accounting advice. This material has been prepared for informational purposes only, and is not intended to provide, and should not be relied on for tax, legal or accounting advice. You should consult your own tax, legal and accounting advisors before engaging in any transaction. For further information about HORAN Wealth, LLC, please see our Client Relationship Summary at adviserinfo.sec.gov/firm/summary/333974.