
Author: David I. Templeton, CFA, Principal and Portfolio Manager
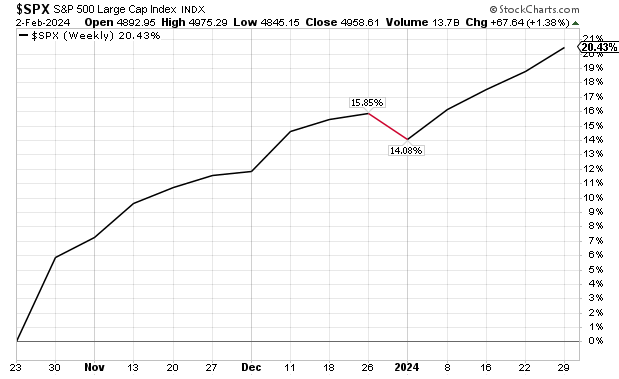
The S&P 500 Index has been on an uptrend since late October. Over the past 14 weeks, the S&P 500 has generated a positive return in 13 of the weeks, with a price return of 20.43%.
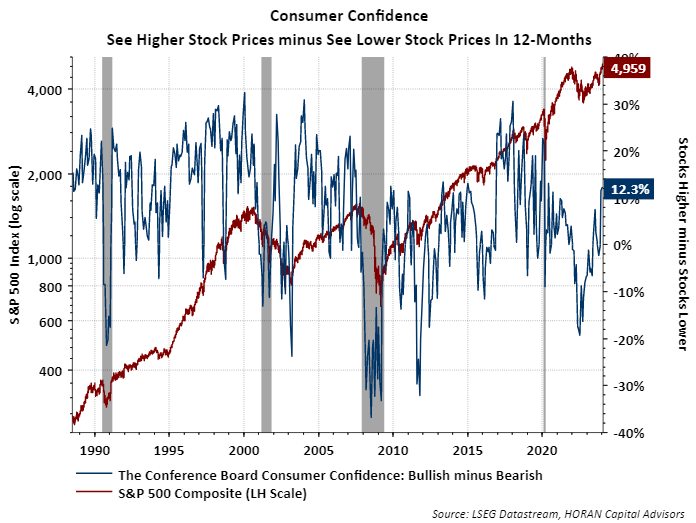
The move higher in stock prices has predictably led to an improvement in individual investor confidence. The first chart below shows the Conference Board's survey of consumer's expectation about the future direction of stock prices. Individuals bullish versus bearish about stock prices in the next 12 months has trended higher since July of 2022. The measure is at or near levels reached before prior market turning points.
The American Association of Individual Investors Sentiment Survey is also at an extreme bullishness level. Both the current bullishness reading and the 8-week moving average are in excessive bullishness territory.
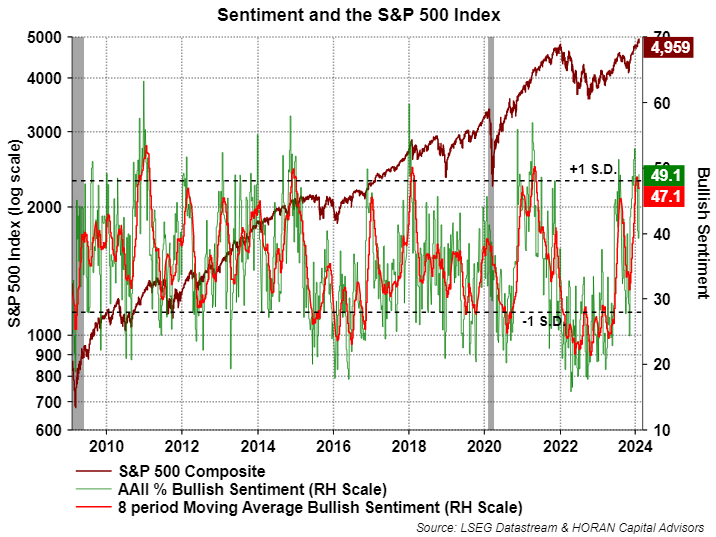
Other measures of sentiment are showing similar results, i.e., bullish investors. With investor sentiment measures being contrarian ones, they tend to be most actionable at their extremes. With the S&P 500 Index in an uptrend for most of the past 14-weeks, a pullback would not be unexpected.
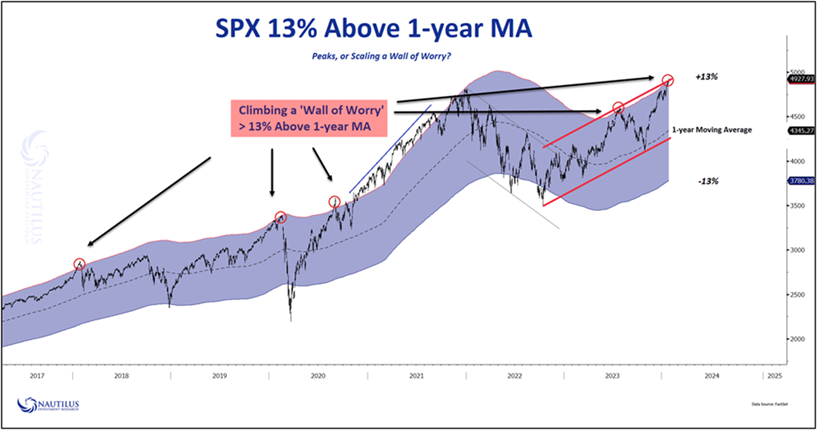
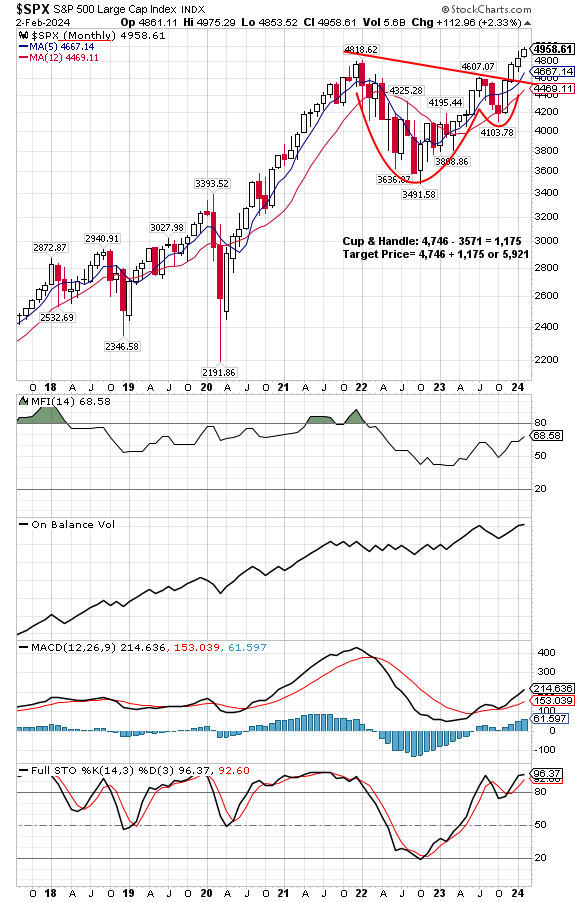
Below is a monthly chart of the S&P 500 Index going back about five years. Market action since the beginning of 2022 has traced out a cup & handle chart pattern. Technical analysis would suggest the chart pattern's target price for the S&P 500 Index is approximately 5,921. With the market having broken through resistance and in a nearly 14-week move to the upside, a breather in the advance would not be a surprise as seen in the above chart. Other technical indicators are suggesting the market is near term overbought as well.
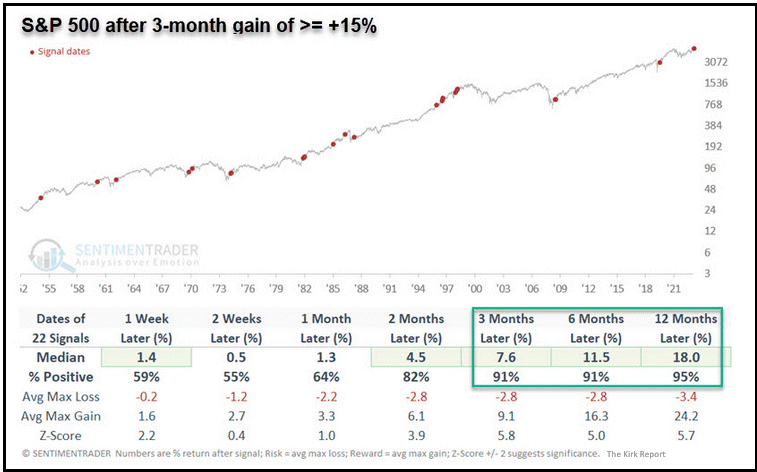
Lastly, although a near term pullback or consolidation of recent gains would not be a surprise, historically, the size of recent market gains suggests equity returns might be favorable looking out the next 3, 6 and 12 months. Any market pullback might be viewed by investors not sufficiently invested in the market as a buy the dip opportunity.
HORAN Wealth, LLC is an SEC registered investment advisor. The information herein has been obtained from sources believed to be reliable, but we cannot assure its accuracy or completeness. Neither the information nor any opinion expressed constitutes a solicitation for the purchase or sale of any security. Any reference to past performance is not to be implied or construed as a guarantee of future results. Market conditions can vary widely over time and there is always the potential of losing money when investing in securities. HORAN Wealth and its affiliates do not provide tax, legal or accounting advice. This material has been prepared for informational purposes only, and is not intended to provide, and should not be relied on for tax, legal or accounting advice. You should consult your own tax, legal and accounting advisors before engaging in any transaction. For further information about HORAN Wealth, LLC, please see our Client Relationship Summary at adviserinfo.sec.gov/firm/summary/333974.