
Author: David I. Templeton, CFA, Principal and Chief Investment Officer
Investors in stocks have enjoyed favorable returns across many asset classes over the last three years. The S&P 500 Index's 3-year annualized total return as of December 31, 2025 is over 23%, meaning an investor earned on average 23% in each year of the last three years. A number of other asset classes have generated similar results, or at least double digit returns, over this same three-year time period. These strong results have led to investor sentiment moving higher and entering overly bullish sentiment levels. Investor sentiment measures are contrarian ones and when sentiment becomes overly bullish, the market could be setting itself up for a pullback.
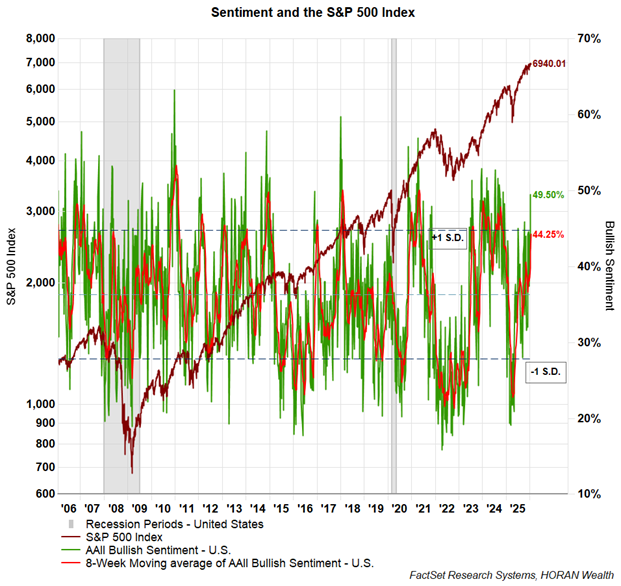
The first chart below shows the Sentiment Survey results conducted by the American Association of Individual Investors (AAII). The recent survey results show bullish sentiment at 49.50% and above the one standard deviation level and moving into an overly bullish level. The red line represents the 6-period moving average of the sentiment and it remains in the neutral zone but is trending higher.
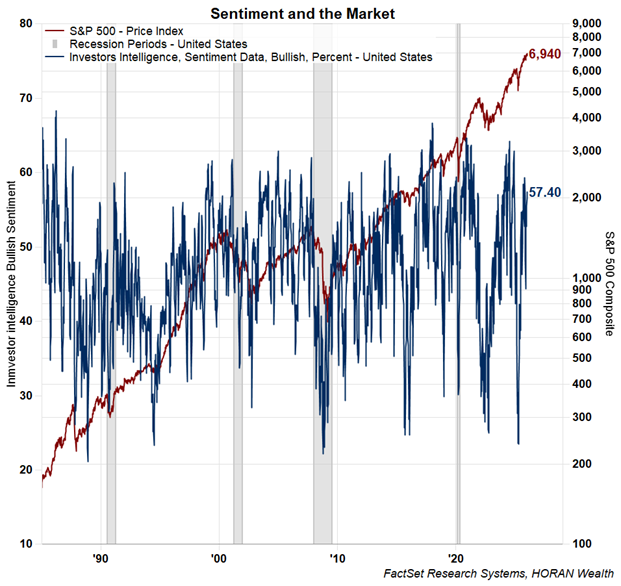
The Investor Intelligence Advisor Sentiment measure has moved to an overly bullish level as well. This indicator surveys over 100 independent investment newsletters and reports the percentage of advisors that are bullish, bearish and those that expect a correction. Extreme levels of the indicator often occur at major market turning points. Historically, bullish readings above 60 have occurred at market turning points and today's reading is 57.40% as seen in the below chart.
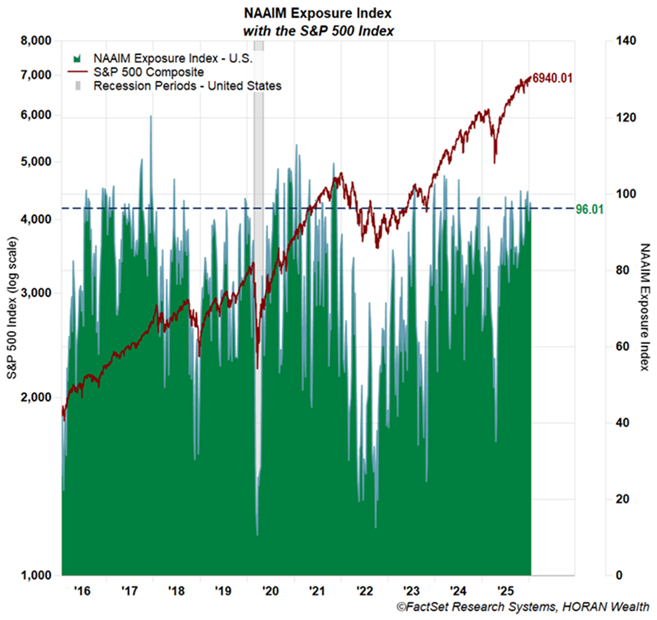
Lastly, the NAAIM Exposure Index is a measure of member firms who are active money managers. These firms are asked each week to provide a number which represents their overall equity exposure at the market close on a specific day of the week, currently Wednesdays. Responses are tallied and averaged to provide the average long (or short) position of all NAAIM managers. Extreme levels of the NAAIM Exposure Index have generally coincided with equity market turning points just as the case with the AAII sentiment survey and Investor Intelligence readings. For the NAAIM member firms, the current reading is 96.01%.
In conclusion, the equity market is coming of a strong three-year return period. For 2026, economic and company data continue to look positive; however, the equity market does not move higher in a straight line. Knowing it is difficult to time the market, investors overweight one asset class, say large cap stocks, may want to consider using this point in time to rebalance to other asset classes. As noted in an earlier blog post, a rotation or broadening of market participation is occurring at the moment and other investors seem to be adjusting their investments too.
HORAN Wealth, LLC is an SEC registered investment advisor. The information herein has been obtained from sources believed to be reliable, but we cannot assure its accuracy or completeness. Neither the information nor any opinion expressed constitutes a solicitation for the purchase or sale of any security. Any reference to past performance is not to be implied or construed as a guarantee of future results. Market conditions can vary widely over time and there is always the potential of losing money when investing in securities. HORAN Wealth and its affiliates do not provide tax, legal or accounting advice. This material has been prepared for informational purposes only, and is not intended to provide, and should not be relied on for tax, legal or accounting advice. You should consult your own tax, legal and accounting advisors before engaging in any transaction. For further information about HORAN Wealth, LLC, please see our Client Relationship Summary at adviserinfo.sec.gov/firm/summary/333974.