
Author: David I. Templeton, CFA, Principal and Portfolio Manager
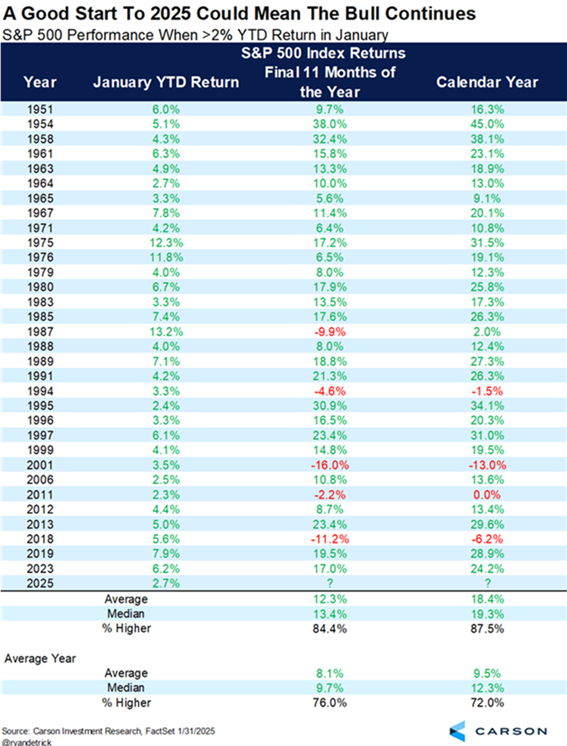
With the month of January now behind investors for 2025, one mantra surrounding future stock market performance is known as the January Effect. Broadly, it is stated that if the month of January is positive for the market so goes the rest of the year. In reality though, the indicator has little predictive significance. On the other hand, the magnitude of the market's January return does tend to have some significance. The below chart, produced by Ryan Detrick, Chief Market Strategist at Carson Group, shows going back to 1951, when the market is up more than 2% in January the rest of the year is positive 87.5% of the time or was positive in 28 out of 32 years. The average return equaled 18.4% versus an average year market return of 8.1%.
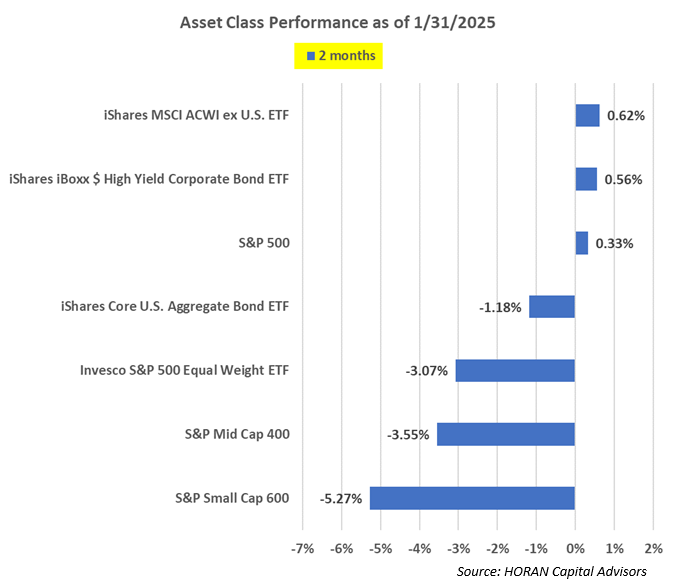
At the risk of sounding like a broken record, now that January is in the rearview mirror, it is worth noting the S&P 500 Index was not the top performer in the month. Better performance was seen out of small cap and mid cap stocks. Also outperforming the capitalization weighted S&P 500 Index was the Equal Weighted S&P 500 Index (RSP), returning 3.43% for the month compared to the S&P 500 Index return of 2.78%. The equal weighted return represents the average return for a stock in the S&P 500 Index.

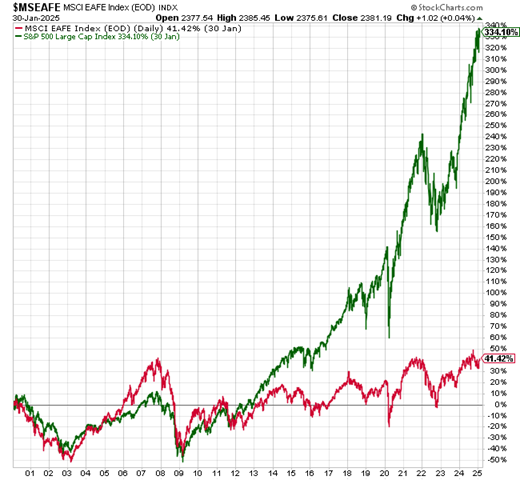
And lastly, in addition to broadening performance across other U.S. equity segments, over the last two months, international equities have outperformed their U.S. counterparts. Two months is a short period of time, and U.S. Dollar strength can serve as a headwind for international returns from a U.S. investor perspective, but investors should be open to the possibility of international opportunities. As the second chart below shows, international performance has lagged the U.S. market since the 2008/2009 Great Financial Crisis.
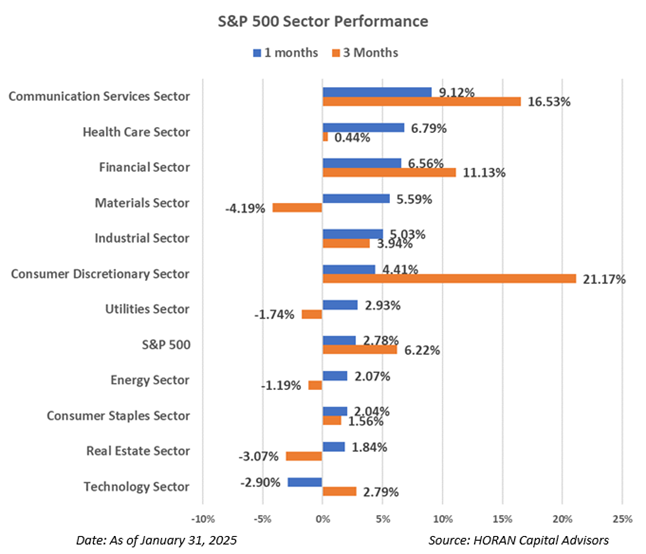
And just as a follow up to the blog article at the beginning of this past week, information technology stock performance for the month has landed at the bottom of the sector return ranking. Also, seven of the sector returns are outperforming the S&P 500 Index as well. Again, this broadening of performance is a healthy market variable if it can be sustained.
HORAN Wealth, LLC is an SEC registered investment advisor. The information herein has been obtained from sources believed to be reliable, but we cannot assure its accuracy or completeness. Neither the information nor any opinion expressed constitutes a solicitation for the purchase or sale of any security. Any reference to past performance is not to be implied or construed as a guarantee of future results. Market conditions can vary widely over time and there is always the potential of losing money when investing in securities. HORAN Wealth and its affiliates do not provide tax, legal or accounting advice. This material has been prepared for informational purposes only, and is not intended to provide, and should not be relied on for tax, legal or accounting advice. You should consult your own tax, legal and accounting advisors before engaging in any transaction. For further information about HORAN Wealth, LLC, please see our Client Relationship Summary at adviserinfo.sec.gov/firm/summary/333974.