

Author: David I. Templeton, CFA, Principal and Chief Investment Officer
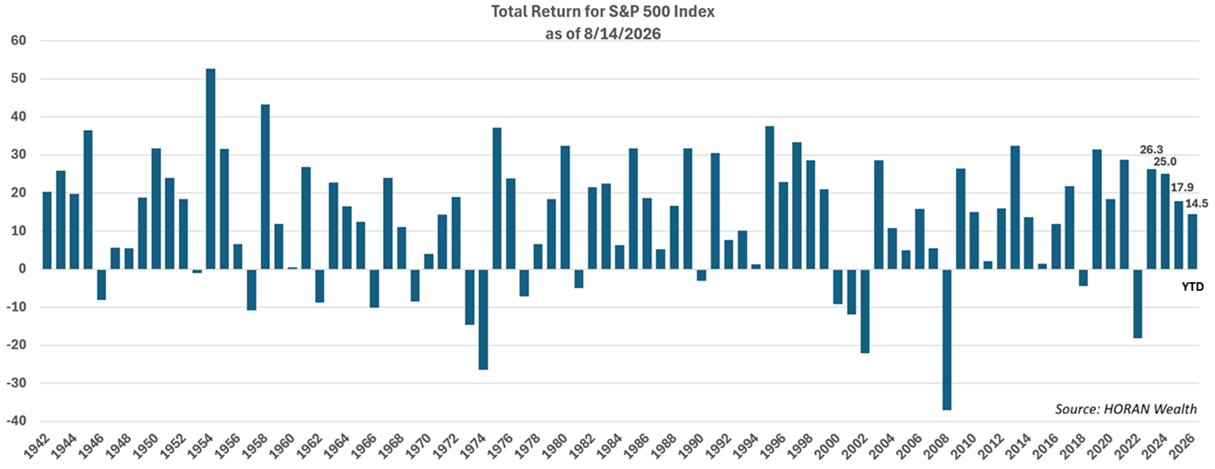
For investors in the equity market, it seems the stock market only knows one direction and that is a move higher. The S&P 500 Index is in its fourth year of positive returns as seen in the below chart. As the chart shows, it is not uncommon for the S&P 500 Index to string together consecutive years of positive returns. In short, one could say strength begets strength.
Earnings: Stronger Growth Now but Slower Next Year
Contributing to the growth in the market is the growth in earnings for S&P 500 companies. As is often said that over time stock prices follow earnings. In that regard, as the reporting by companies for second quarter earnings continues, the year over year growth rate has been astonishing. As the below table shows, Q2 2026 earnings to date are up 51.6% on a year over year basis. Four months ago, the expectation by Wall Street analyst for Q2 2026 earnings was earnings would be up 20% on a year over year basis. There are some potentially one-time variables accounting for the higher earnings growth rate, one being the mark to market of a few company equity portfolios. For all of 2026 earnings are expected to be up 30.8% YoY. For the 2027 calendar year earnings are expected to by higher by 15.2% versus 2026. Although this represents mid-teens growth rate, the rate declines minus 15.6 percentage points from 2026 to 2027. Historically, investors/the market tend to react negatively to a slowing earnings growth rate, and might investors begin focusing on this as they look into 2027? As it is, the market trades on future growth and not what has already transpired in the past.

Artificial Intelligence and Data Center Build Out
Certainly there are a number of issues one can point to that would cause one to question the sustainability of the rally. One factor that is currently driving a great deal of the economic and business activity is the investment in artificial intelligence (A.I.) This investment includes the build out of data centers by the five large hyperscalers (META, ORCL, MSFT, AMZN and GOOGL.) Many companies and industries are benefiting from this build out as over $1 trillion in capital expenditures is expected by these hyperscalers in 2027. Companies like Caterpillar (CAT), Trane Technologies (TT), many utilities, and I could go on, are benefiting from the dollars being spent in this area. The obvious questions is what the return on investment on this capex will be. At the moment, as a group, the hyperscalers free cash flow has turned negative.
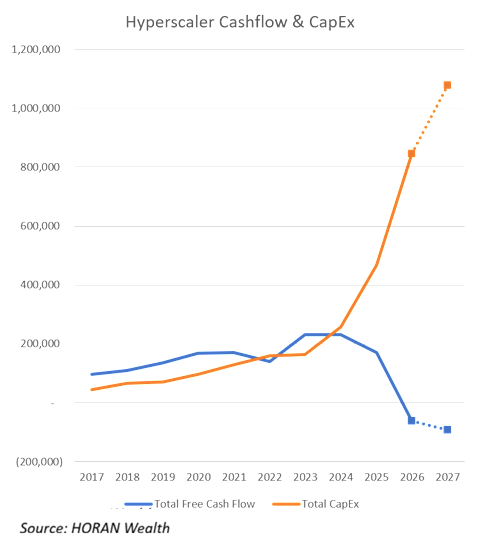
One underlying issue with the level of capital expenditures is how they are being financed. Some of the financing structures today resemble those in the lead up to the bursting of the technology bubble in 2000. One particular financing structure is suppliers financing the purchase of their products that leads to what some call circular financing, i.e. the sellers are providing the funds or backstopping the purchase of the sellers' products. One can go down a rabbit hole on this; however, the demand for data center capacity does appear to be real as about 80% of the available capacity is estimated to be spoken for. This compares to less than 10% of available capacity with the fiber optic build out in the lead up to the technology bubble.
Higher Interest Rates a Headwind for Stocks
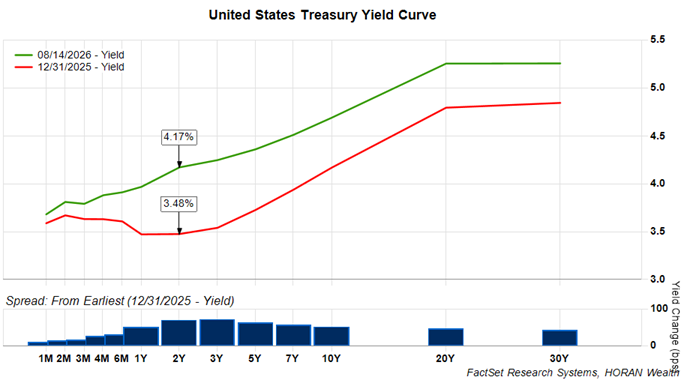
In 2022 and into 2023 the Federal Reserve increased the Fed Funds rate eleven times. This pace of increase resulted in nearly all investment asset classes experiencing a negative return in 2022. One could say that higher interest rates were a headwind for stocks. Also, the increasing interest rate environment caused bond prices to decline and bonds generated a negative return too. Today, there is chatter the Fed needs to increase short term interest rates as inflation remains above the Fed's 2% target. The Fed actually looks at a number of variables and another one is Personal Consumption Expenditure Price Index and the June reading was 3.7% (August 26 is the next release.) Market interest rates have moved higher since the end of last year. The green line in the below chart is the current yield curve, and the red line represents the yield curve at the end of 2025. Rates have risen across all maturities.
On a longer-term view, the 10-year U.S. Treasury yield (green line below) has increased from about .50% to its current 4.68%. Over the thirty-year view on the chart, the correlation of the S&P 500 Index to a higher 10-year rate is -.22. On a shorter view, last 20 years, the correlation is a positive .25. So, in other words, higher interest rates are not necessarily a headwind for stocks.
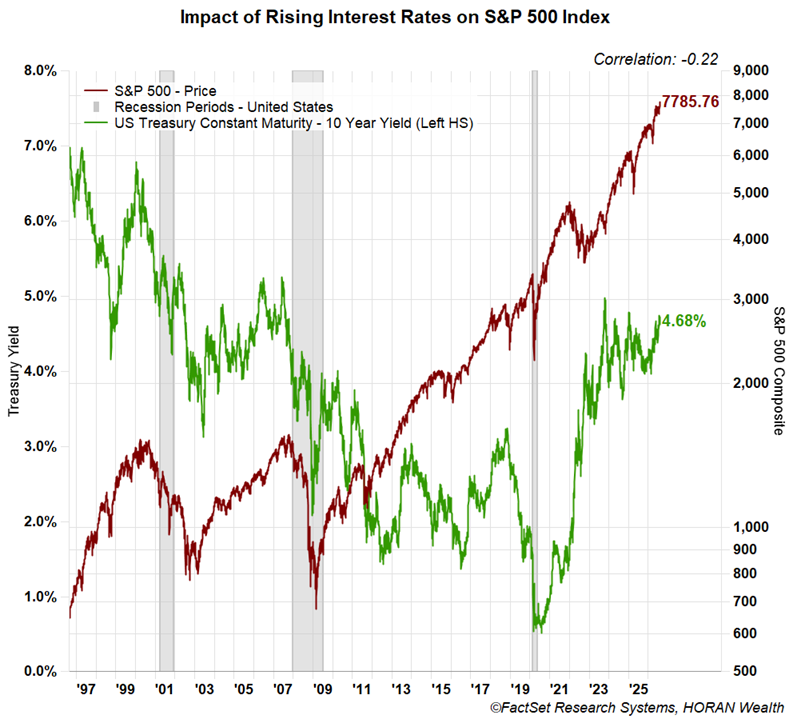
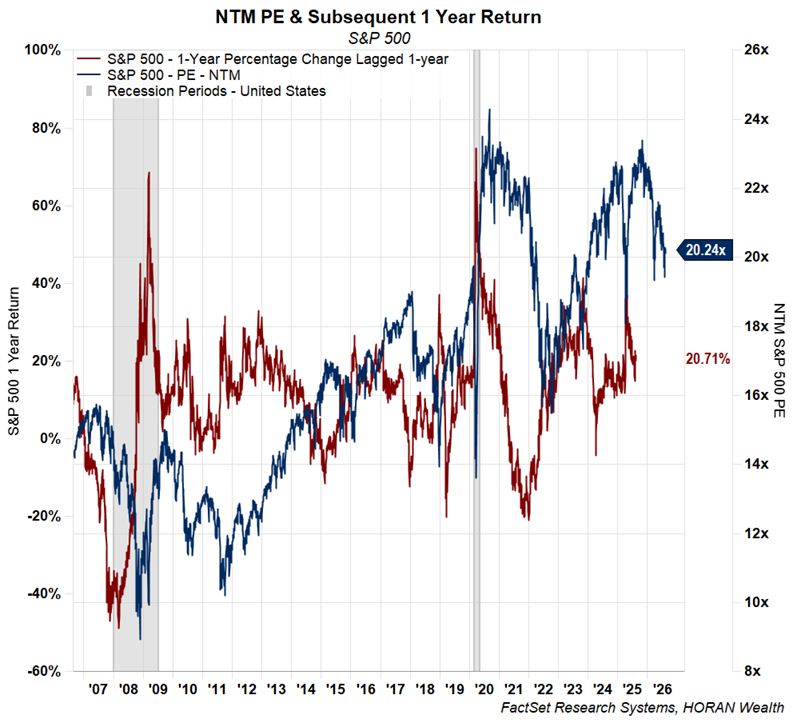
There are many factors that determine the interplay between interest rates and stocks and other asset classes. For stocks, higher rates can serve as a detractor in the discounted cash flow valuation analysis models for equities. Additionally, higher rates can make fixed income or bond investments more attractive. In the current environment though, as noted earlier, YoY earnings are up over 50% in the 2nd quarter and expected to be up over 30% for the 2026 calendar year. At the same time, the S&P 500 Index is up only 21.8% over the last 12-months and up 14.5% year to date through August 14. In short, the S&P 500's valuation has gotten cheaper this year as earnings growth is outpacing the market's growth. Might it be the case interest rates have less of a negative influence on stocks at the moment then?
U.S.'s Poor Fiscal Situation
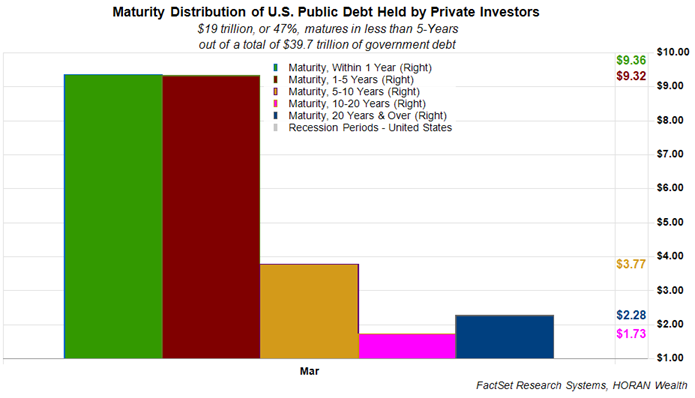
As noted earlier interest rates continue to trend higher but are likely nearing a more normal level for interest rates. As seen below the U.S. must refinance nearly 50% of its current outstanding debt, $19 trillion, within the next five years. At current market interest rates, the rate on the new rollover debt would be some 30% higher, or 50 to 100 basis points higher, than the debt that is maturing.
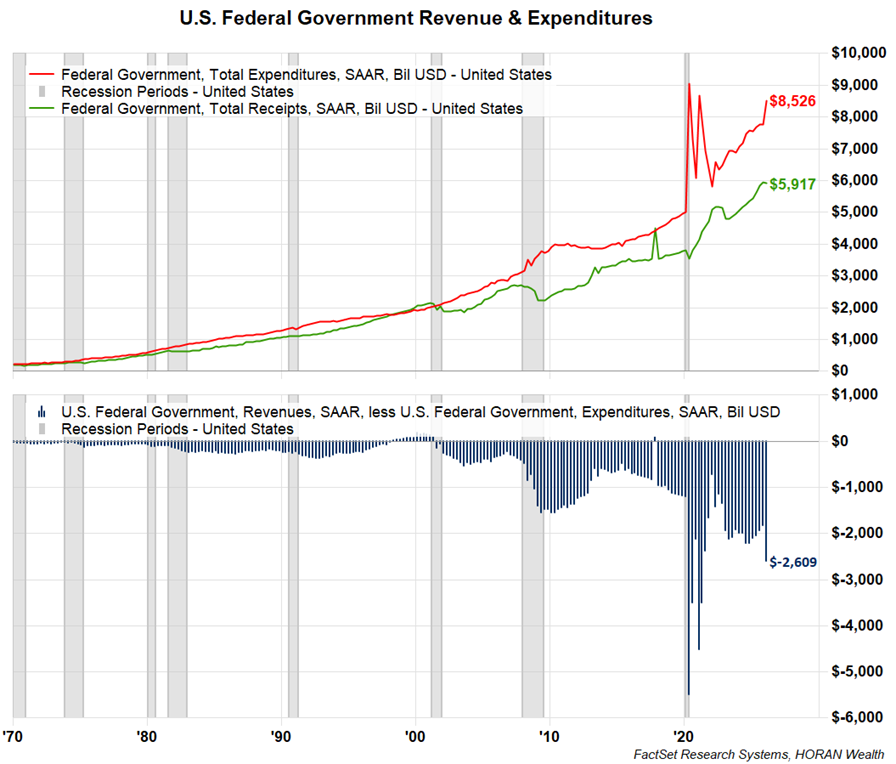
Compounding the debt issue is the fact the government's budget deficit continues to run at over $2 trillion. With the government debt continuing to increase, along with interest rates that are trending higher, interest expense on the debt is running at an annualized rate of $1.4 trillion. This is now the second largest spending item in the budget behind social security expenditures. The federal budget in President Bill Clinton's early term was lower than the current level of interest expense.
Climbing the Wall of Worry
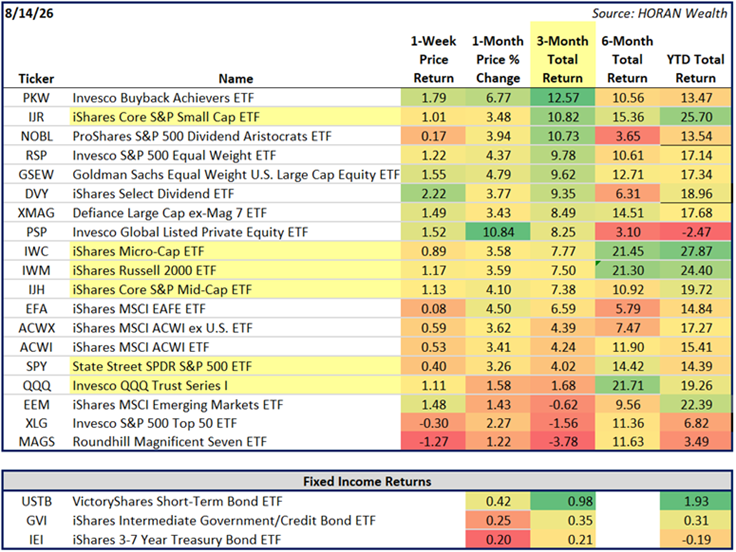
The point of listing some of the above items is highlighting the fact investors could find many reasons to sell stocks. Given the strong performance of the equity market and specifically in the stocks benefiting from the A.I. growth, maybe trimming some of those positions make sense, a repositioning of sorts. Below is a table containing just a few investment categories and the year-to-date column shows all the equity returns are positive except for the private equity ETF (PSP.) Importantly though, the returns are sorted on the 3-month return column and the Magnificent Seven ETF (MAGS) is at the bottom of the return table. The largest 50 S&P 500 stock ETF (XLG) is near the bottom as well. At the top of the table are the ProShares Dividend Aristocrats ETF (NOBL), the iShares Core Small Cap ETF (IJR), and the Goldman Equal Weight ETF (GSEW.) In short, the equity market seems to be broadening out and performance is being generated by a larger number of stocks, and not just the mega caps that drove market returns over the last several years. One thing the market tends to do is climb the proverbial Wall of Worry.
Disclosure: Firm/Family long MSFT, AMZN, GOOL, TT, CAT
HORAN Wealth, LLC is an SEC registered investment advisor. The information herein has been obtained from sources believed to be reliable, but we cannot assure its accuracy or completeness. Neither the information nor any opinion expressed constitutes a solicitation for the purchase or sale of any security. Any reference to past performance is not to be implied or construed as a guarantee of future results. Market conditions can vary widely over time and there is always the potential of losing money when investing in securities. HORAN Wealth and its affiliates do not provide tax, legal or accounting advice. This material has been prepared for informational purposes only, and is not intended to provide, and should not be relied on for tax, legal or accounting advice. You should consult your own tax, legal and accounting advisors before engaging in any transaction. For further information about HORAN Wealth, LLC, please see our Client Relationship Summary at adviserinfo.sec.gov/firm/summary/333974.