
Author: David I. Templeton, CFA, Principal and Portfolio Manager
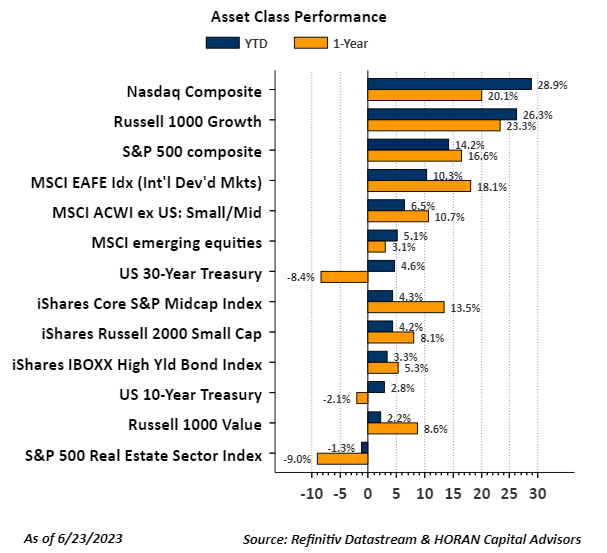
A characteristic of the market advance this year is the fact a small number of stocks are contributing to the advance. Further, the stocks contributing the most to performance are mostly large capitalization companies. This has led to the large cap indexes, specifically those comprised of U.S. equities, leading market performance. As the below bar chart shows, out of the asset classes displayed on the chart, the top three performing indexes are U.S. focused ones, i.e., the Nasdaq Composite Index, the Russell 1000 Growth Index and the S&P 500 Index.
In terms of narrow market breadth, the below chart shows the average return of seven large capitalization stocks, Meta Platforms (META), Amazon (AMZN), Apple (AAPL), Microsoft (MSFT), NVIDIA (NVDA), and Alphabet (GOOGL), compared to several other indexes. The average return of these seven stocks is positive 87.7% this year through June 23, 2023. The capitalization weighted S&P 500 Index is up 14.2% and does include the seven stocks just noted.
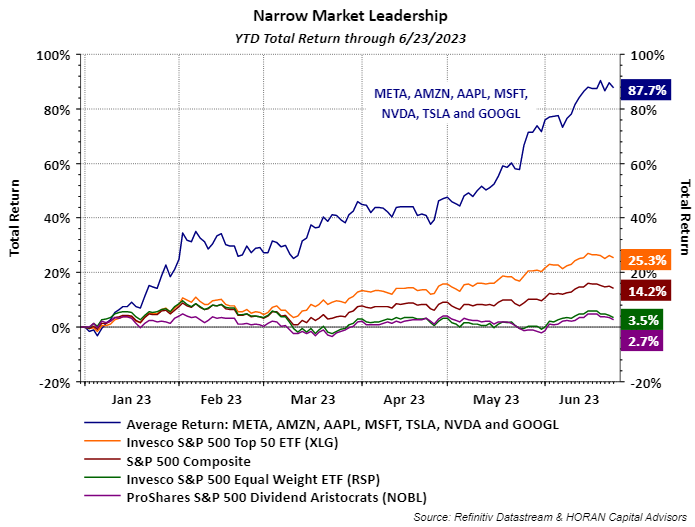
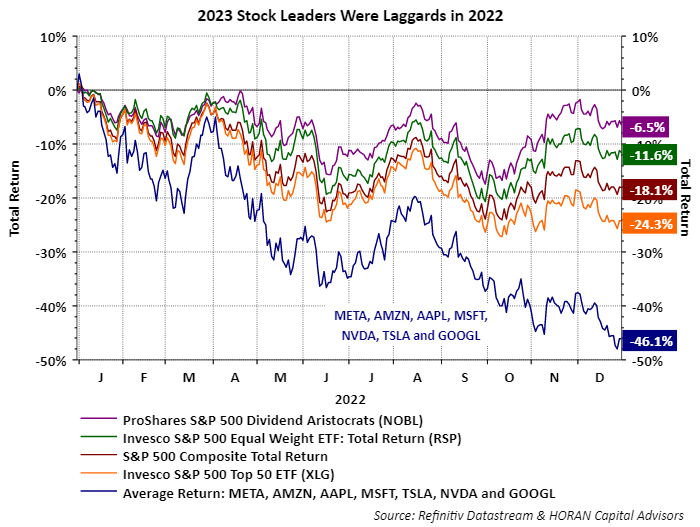
Last year these same seven stocks underperformed the broader S&P 500 Index with an average return of -46.1% versus the S&P 500 Index decline of -18.1%. In fact, on the below chart, the return rank of each respective index is the exact reverse of the return rank this year.
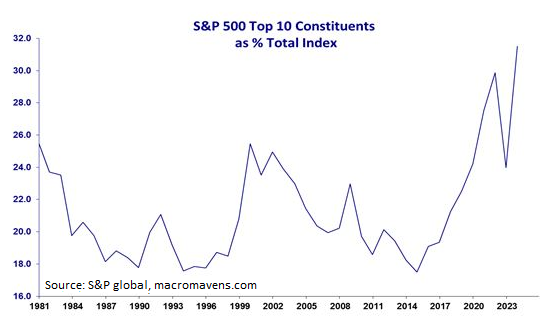
With returns concentrated in a limited number of mega cap stocks, these stocks are garnering a larger percentage weight in the S&P 500 Index. These seven stocks, and the other three that comprise the Top 10 in the index, now represent about 32% of the index weighting. This is significantly higher than the Top 10 weighting at the height of the technology bubble in 2000.
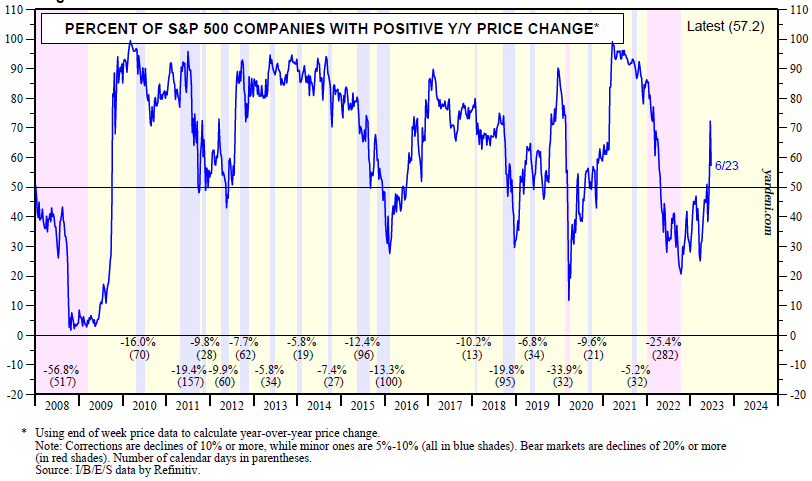
For the large cap equity market to continue its advance in the second half of the year, it would be healthy to so a broader number of stocks participate in the rally. In looking at the below chart, it does appear a larger number of stocks are attempting to participate in the rally with the percentage of stocks achieving a positive year over year return increasing and now equal to 57.2%.
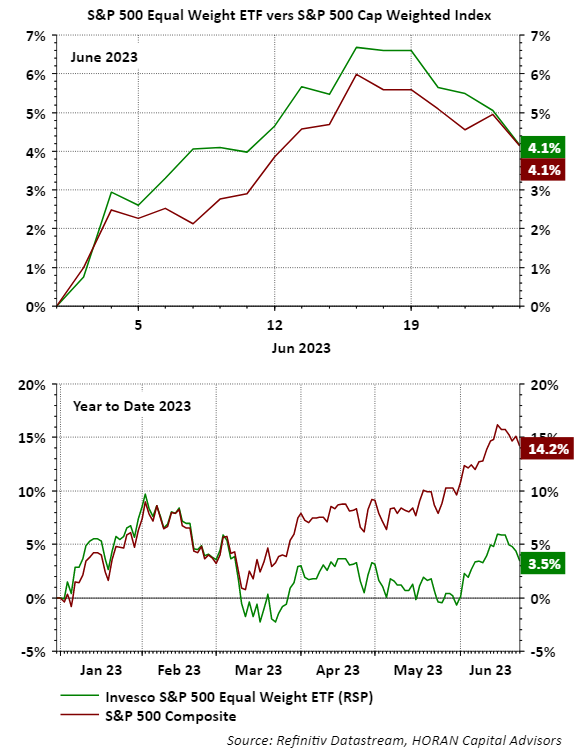
And lastly, in the month of June through Friday's close, although a short time period, the equal weighted S&P 500 Index has been outperforming the cap weighted S&P 500 Index. The outperformance was lost with Friday's return; however, investors seem to be attracted to stocks other than the handful of mega cap stocks that have garnered outsized attention so far this year. A broader group of stocks participating in the advance would be a favorable outcome for market performance in the balance of the year.
HORAN Wealth, LLC is an SEC registered investment advisor. The information herein has been obtained from sources believed to be reliable, but we cannot assure its accuracy or completeness. Neither the information nor any opinion expressed constitutes a solicitation for the purchase or sale of any security. Any reference to past performance is not to be implied or construed as a guarantee of future results. Market conditions can vary widely over time and there is always the potential of losing money when investing in securities. HORAN Wealth and its affiliates do not provide tax, legal or accounting advice. This material has been prepared for informational purposes only, and is not intended to provide, and should not be relied on for tax, legal or accounting advice. You should consult your own tax, legal and accounting advisors before engaging in any transaction. For further information about HORAN Wealth, LLC, please see our Client Relationship Summary at adviserinfo.sec.gov/firm/summary/333974.