
Author: David I. Templeton, CFA, Principal and Portfolio Manager
Investors have experienced another bout of market volatility partly in response to President Trump's pursuit of rebalancing the U.S. trade deficit via tariffs. The tariff announcement occurred on April 2 and yet the S&P 500 Index peaked this year on February 19, closing at 6,144.15. So the market was experiencing a pullback in advance of the announcement; however, the decline accelerated in the four days following the so-called Liberation Day tariff announcement from the White House Rose Garden. In those four days the S&P 500 Index fell -12.62% and reached a low on April 8th, having seen the S&P 500 Index fall nearly -19% from its February high. Were there signals around April 8 that might indicate the equity market was near a low and are there signals indicating further market strength ahead? Following will contain insight into sentiment measures, in no particular order, that investors can evaluate for gaining insight into potential market turning points. The important characteristic of sentiment measures is they are contrarian in nature and most actionable at their extremes. During times of market volatility, sentiment data can offer a deeper understanding of investor behavior—and signal potential shifts in momentum.
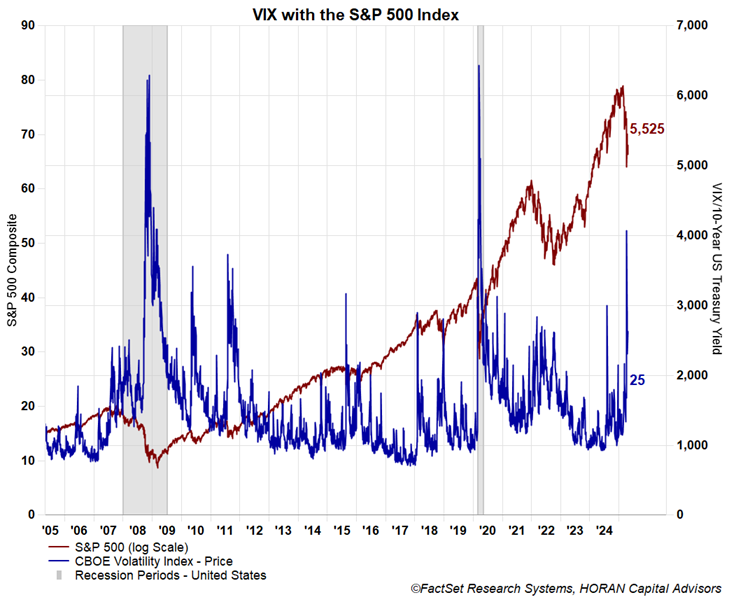
CBOE Volatility Index or VIX:
The VIX is commonly referred to the "investor fear gauge" as it tends to reach its highest levels during times of financial turmoil and investor fear. As the market recovers and investor fear subsides the VIX level tends to decline. According to the CBOE:
"since the VIX Index introduction in 1993, the VIX has been considered by many to be the world’s premier barometer of investor sentiment and market volatility. The VIX Index is an implied volatility index that measures the market’s expectation of 30-day S&P 500® volatility implicit in the prices of near-term S&P 500 options. VIX is quoted in percentage points, just like the standard deviation of a rate of return."
The VIX reach a recent peak on April 8 when it hit 52 and April 8 was the recent low for the S&P 500 Index as seen in the below chart.
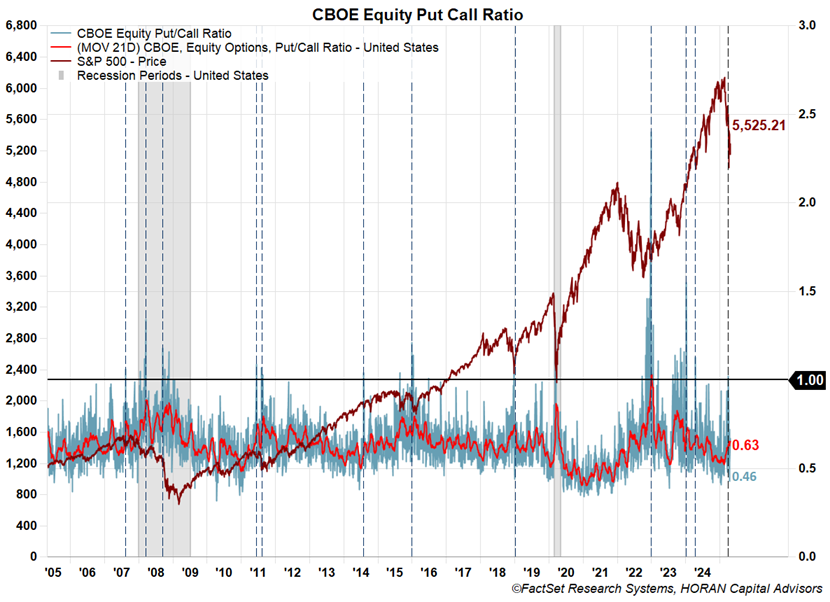
Equity Put/Call Ratio:
The CBOE Equity Put/Call ratio tends to measure the sentiment of investors by dividing put volume by call volume. A put option is a contract that gives the buyer of the put the right to sell a security at a predetermined price within a certain time frame. If an investor believes the market may decline, the investor can buy puts giving the buyer the right to sell the underlying security at a higher price than the market price. In other words, a signal that investors are overly bearish would be an increase in the volume for put options relative to call volume. Thus, as the put volume increases the ratio of put volume to call volume increases. P/C ratios above 1.0 tend to signal excessive pessimism. One factor about the option market is option buyers lose about 90% of the time and this makes this indicator a good contrarian one. About one week before the market bottomed, the CBOE Equity Put/Call ratio reached 1.02 on April 3, 2025 as seen below.
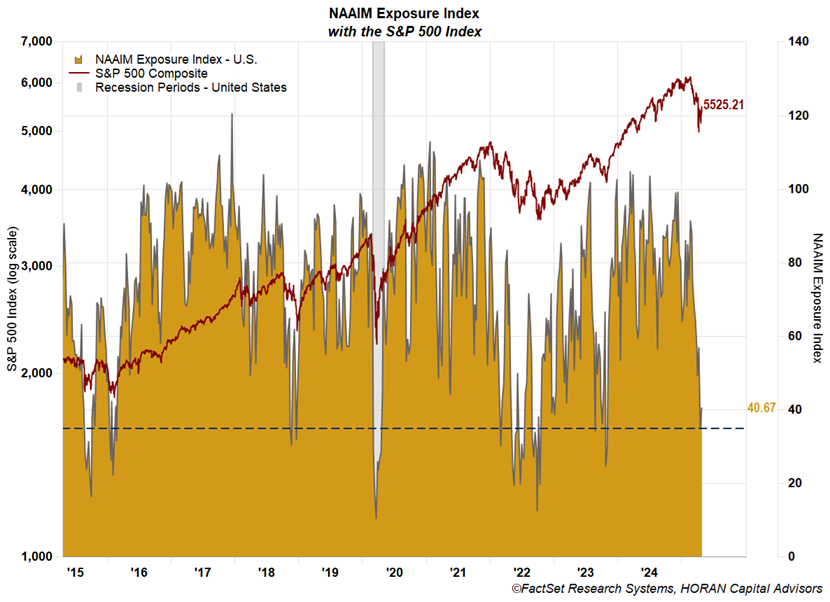
NAAIM Exposure Index:
The NAAIM Exposure Index consists of a weekly survey of NAAIM member firms who are active money managers and provides a number which represents their overall equity exposure at the market close on a specific day of the week, currently Wednesday. Responses are tallied and averaged to provide the average long (or short) position or all NAAIM managers as a group. Near the recent market low in April, institutional money managers had equity allocations of just 35.16% a level significantly lower than the 91.48% exposure level when the market was at its February high. Since the April level, the NAAIM Exposure Index has risen to 40.67%, a sign active managers have increased equity exposure.
AAII Sentiment Survey:
The AAII Sentiment Survey is a weekly report by The American Association of Individual Investors that summarizes individuals' response to their view of the market over the next six months. The eligible survey response for investors is whether their prospective market view is one of being bullish, bearish or neutral. AAII reports the result of each weekly survey on Thursdays. In the week prior to the market's April 8 low, AAII reported bullishness by individuals at a low 21.76%. The bullishness reading came in lower than the average reading minus one standard deviation. The bullishness level remains at a low level, reported at 21.94% this past week, and with the recent sharp recovery for the market, one might say the market is climbing the proverbial wall of worry.

CNN Business Fear & Greed Index:
The CNN Business Fear & Greed Index incorporates seven indicators to arrive at a sentiment index reading. Indicators included in the calculation are: put call option data, junk bond demand, market volatility (VIX), stock market strength, i.e., the number of stocks hitting 52-week highs, stock market breath and safe haven demand, i.e., bond versus stock performance. What makes this a useful indicator to evaluate is the fact it incorporates a number of sentiment measures into one index. This index reached an 'extreme fear' reading of 3 on April 8, the day the S&P 500 Index bottomed. The Fear & Greed Index remains in the fear range, yet it has increased to 35 on April 25 as seen in the below chart.

The above outlines just a sample of sentiment measures investors can evaluate in an effort to gauge sentiment around the market. These indicators are contrarian ones and no one indicator provides perfect insight into the potential direction of the market. In hindsight though, and for now, April 8 has turned into at least an interim low for the S&P 500 Index. As noted above, many of the above indicators were overly bearish on or around this date. Subsequent to the April 8 low, the S&P 500 Index is up 10.89% in the succeeding twelve trading days ending April 25, 2025. With this sharp rebound and knowing the market does not go up in a straight line, pullbacks along the way should be expected. For investors though, incorporating sentiment measures into one's analysis can reduce some of the emotional aspects of investment decisions. These signals are just one part of a disciplined investment process—but they offer valuable context in fast-moving and/or volatile markets.
HORAN Wealth is the marketing name of HORAN Securities, Inc. ("HSI") and HORAN Capital Advisors, LLC ("HCA"). Securities Offered Through M Holdings Securities, Inc., a Registered Broker/Dealer, Member FINRA/SIPC. HORAN Wealth Management ("HWM") is the investment advisory firm. HCA is an affiliated investment advisory firm.
The information herein has been obtained from sources believed to be reliable but we cannot assure its accuracy or completeness. Neither the information nor any opinion expressed constitutes a solicitation for the purchase or sale of any security. Any reference to past performance is not to be implied or construed as a guarantee of future results. Market conditions can vary widely over time and there is always the potential of losing money when investing in securities. HORAN Wealth and its affiliates do not provide tax, legal, or accounting advice. This material has been prepared for informational purposes only and is not intended to provide and should not be relied on for tax, legal, or accounting advice. You should consult your own tax, legal, and accounting advisors before engaging in any transaction.