
Author: David I. Templeton, CFA, Principal and Portfolio Manager
V-Shaped Recovery
The S&P 500 Index closed at a new all-time high on Friday, closing at 6,173.07. The prior high of 6,144.15 was reached February 19 after which the market fell -7.7% in the led up to Liberation Day on April 2, the day President Trump announced the administration's broad tariff policy. In the four trading days following Liberation Day, the S&P 500 Index fell another -12.1% reaching a bottom on April 8. In the 60 trading days following the bottom, the Index rebounded nearly 24%, a sharp V-shaped recovery and the quickest on record following a decline of at least 15%.
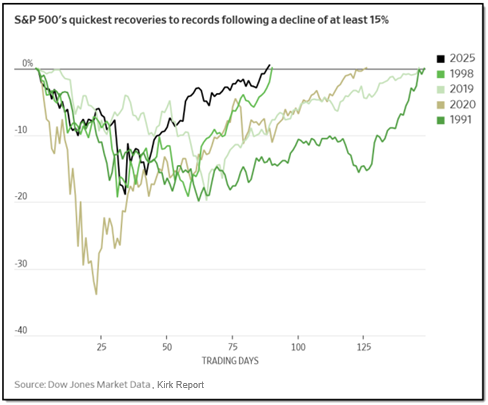
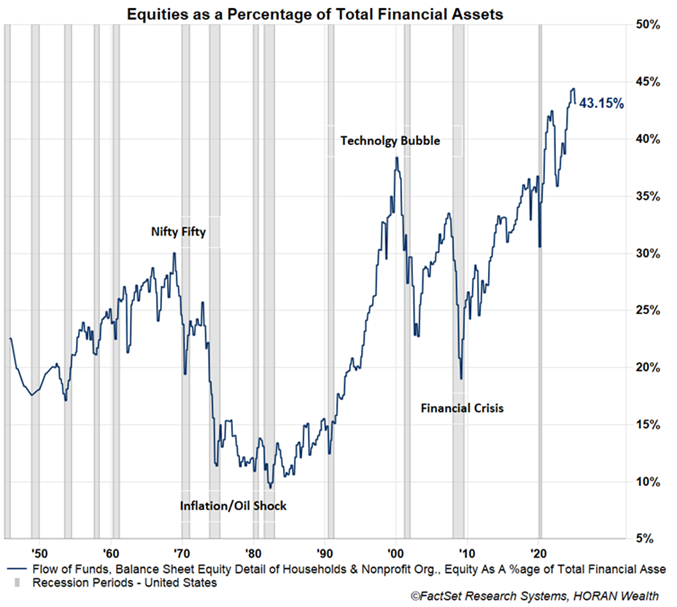
For the year, the S&P 500 Index is now up 4.96% with investors positioned for further equity moves to the upside if equities as a percentage of total financial assets is any indication.
Sharp Recovery Positive for Second Half Equity Return
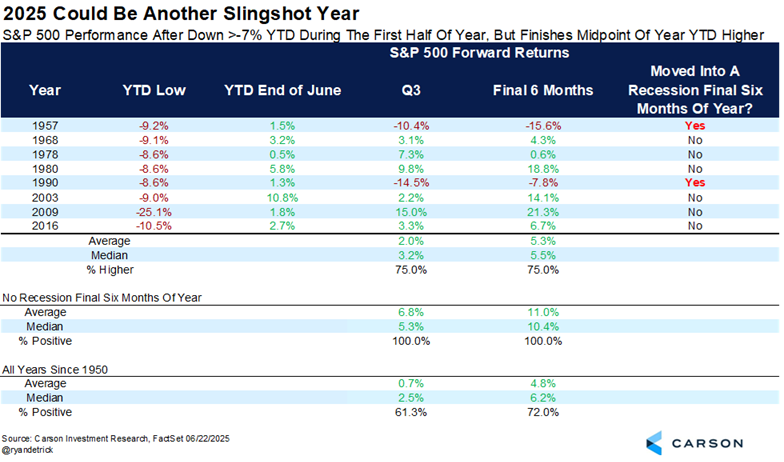
Although the S&P 500 Index erased this near -20% contraction in a short period of time, Ryan Detrick, Chief Market Strategist at Carson Group, shows this strength can carry over to the second half. Ryan notes in years where the market is down more than 7% at some point in the first six months of a year and finishes higher by mid-year, the average return of the S&P 500 Index in the second half is 11%, so long as the economy does not fall into a recession.
Elevated Cash on the Sidelines A Tailwind for Stocks and/or Bonds
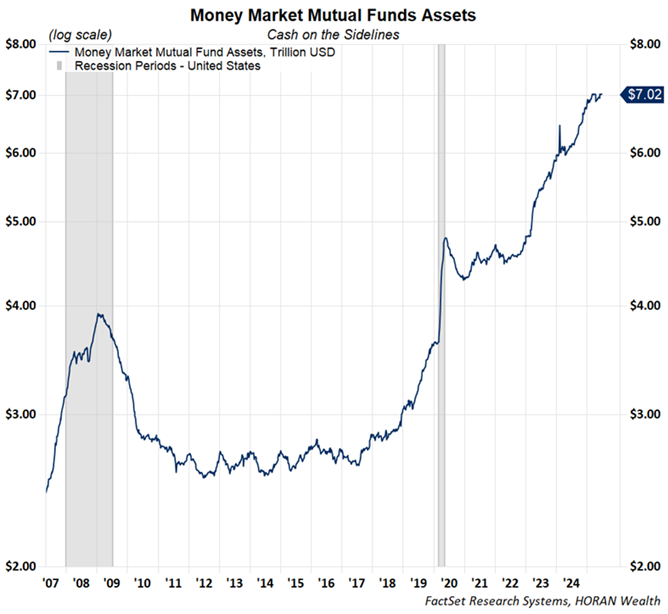
There are factors investor might evaluate that could indicate an equity market due for a little breather. Certainly, the speed of this V-shaped recovery has put the market in an overbought position. On the other hand, there are a number of studies that indicate the market's action in the first half of the year historically can carry over into the second half as noted in the above table, i.e., strength begets strength. And in spite of the apparent high allocation to equities noted earlier, money market fund assets are near a record at $7 trillion.
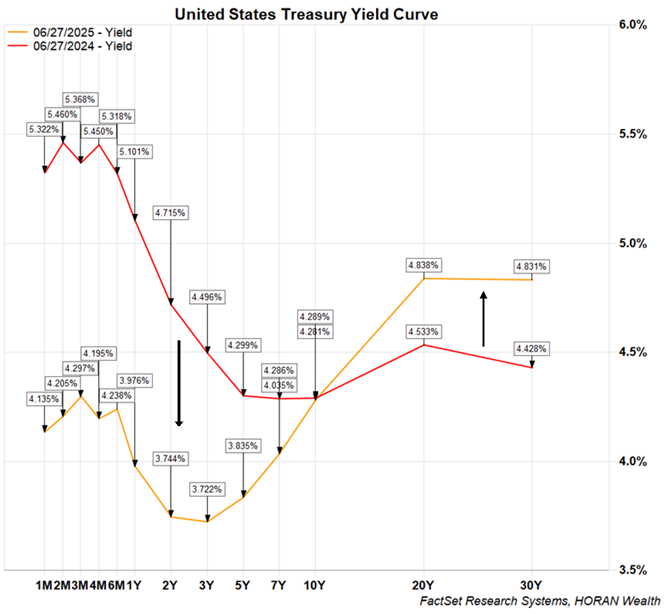
Yield Curve Normalizes
Additionally, more strategists are coming to a conclusion that tariffs are not inflationary as are some Fed members. And with reported inflation now at 2.4% and down from the 9% reported in June 2022 the short end of the Treasury yield curve has come down to the low 4% level with the two-year US Treasury below 4%. The Fed has influence on the very short end of the interest rate curve so with the Fed Funds Target Rate being held at 4.5%, short term US Treasuries, less than 1-year maturity, have remained elevated. However, with the 2–5-year Treasury yield declining and longer-term yields rising, greater than 10-year maturity, the yield curve has become uninverted, i.e., short term rates are once again lower than long term rates.
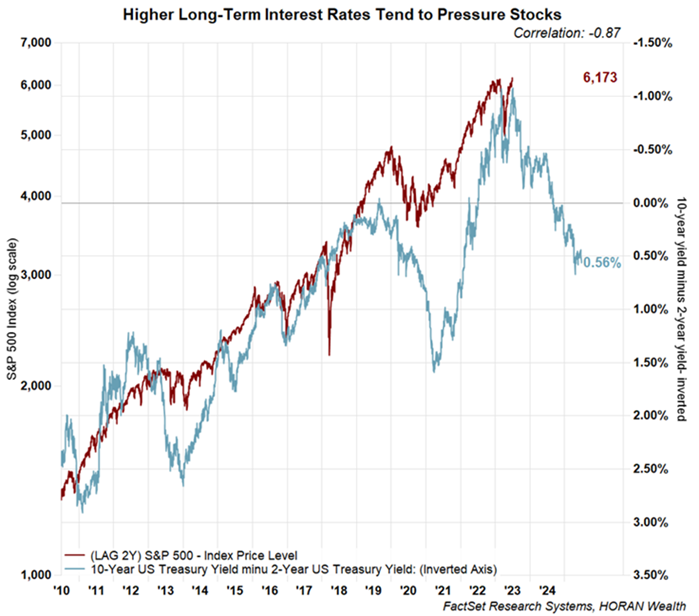
Positive Sloping Yield Curve Could be a Headwind for Stocks
With the yield curve steepening and further steepening likely with a Fed becoming more dovish and likely cutting short term rates later this year, the steeper curve can become a headwind for stocks. The blue line in the below chart is the yield curve but shown on an inverted y-axis. A declining blue line is reflective of a steeper yield curve. The maroon line is the S&P 500 Index lagged by two years. As the chart shows, when the yield curve steepens the S&P 500 Index has a tendency to decline. This high negative correlation has been more pronounced since the Great Financial Crisis of 2008/2009, maybe because the Fed has intervened too much and disrupted a normally functioning business cycle; thus, preventing the cycle from washing out speculation.
There are a number of reasons higher long-term interest rates can serve as a headwind for stocks. One is the fact interest rates are an important variable in how stocks are valued. If a higher interest rate is used to discount future earnings of a company to the present, those future earnings are worth less; thus, pushing up the value of stocks. To correct this increase in valuation or P/E, the price of a stock or the market declines. Also, higher interest rates make bonds more attractive, and a steeper yield curve is a more normal rate structure for the market. These higher interest rates may lead investors to allocate more of their investments to bonds. Certainly, some of the funds can come from money market assets, which are at a near record level as noted earlier, or the funds can come from reducing equity exposure. Also as shown earlier, equity exposure relative to total financial assets is at a historically high level.
The Trend of the Market Can Persist
In summary, a mantra that gets stated from time to time is, 'the trend is your friend'. Since the market bottom in April the trend has been higher. Also, one quote I read recently comes from Larry Hite in an interview in Market Wizards and in reference to a trader, Ed Seykota. What Ed Seykota told Larry Hite was,
"When a market makes a historic new high, it is telling you something. No matter how many people tell you why the market shouldn't be that high, or why nothing has changed, the mere fact that the price is at a new high tells you something has changed."
Investing is a lot about expectations and possibly expectations about the tariffs, inflation and the impact on the market have been too pessimistic. Maybe these expectations are changing.
HORAN Wealth, LLC is an SEC registered investment advisor. The information herein has been obtained from sources believed to be reliable, but we cannot assure its accuracy or completeness. Neither the information nor any opinion expressed constitutes a solicitation for the purchase or sale of any security. Any reference to past performance is not to be implied or construed as a guarantee of future results. Market conditions can vary widely over time and there is always the potential of losing money when investing in securities. HORAN Wealth and its affiliates do not provide tax, legal or accounting advice. This material has been prepared for informational purposes only, and is not intended to provide, and should not be relied on for tax, legal or accounting advice. You should consult your own tax, legal and accounting advisors before engaging in any transaction. For further information about HORAN Wealth, LLC, please see our Client Relationship Summary at adviserinfo.sec.gov/firm/summary/333974.