
Authors: Zac Martin, Investment Associate; David I. Templeton, CFA, Principal and Portfolio Manager
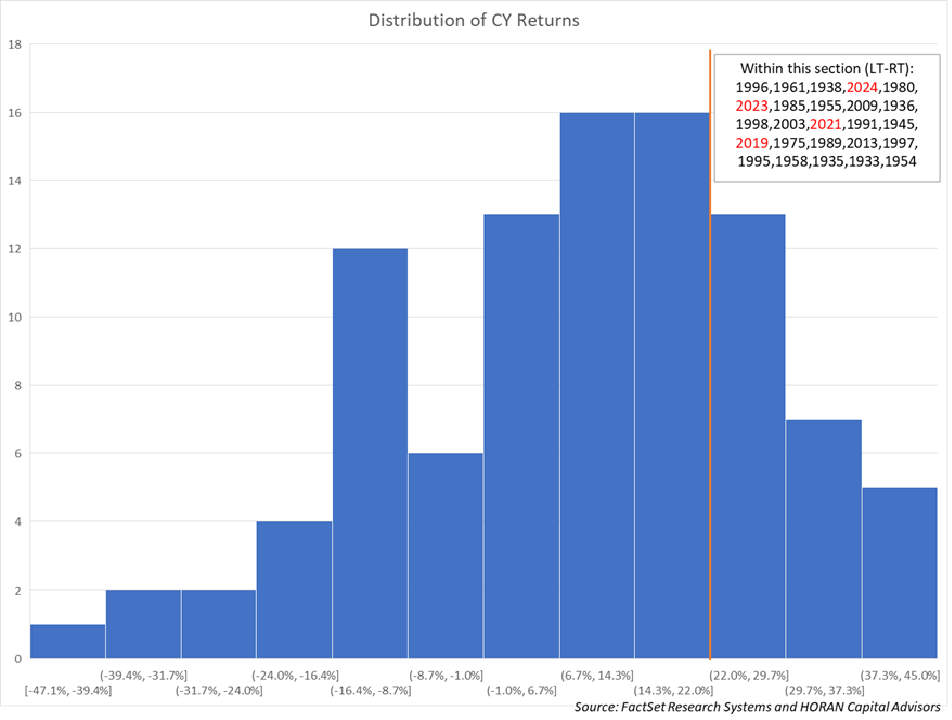
Recent volatility in the market may give investors anxiety about where the market might be headed and influencing emotional decisions that may hurt long run returns. This article zooms out and looks at recent returns relative to history in an effort to potentially reduce one’s anxiety resulting from recent headlines. In 2023 and 2024 the S&P 500 returned 26.3% and 25%, respectively. These two years were in the 79th & 77th percentile of returns since 1928. In fact, three out of the last five years (highlighted in red below) have outperformed 75% of the calendar year returns since 1928. Indeed, the 2020s are so far competing with similar returns seen in the late 90’s; note, that of the top twenty-five returning years, five are from the 90’s.
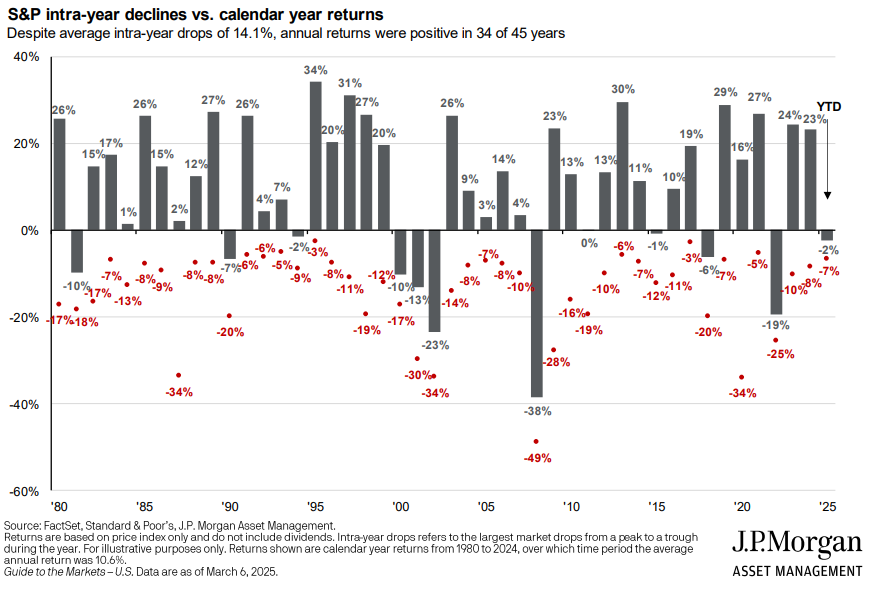
It has been a good decade so far and equity markets have not experienced as much volatility as one would expect given historical trends. In fact, a yearly correction averaging 14% is common for equity markets. Below, a chart from JP Morgan’s Guide to the Markets, highlights this phenomenon.
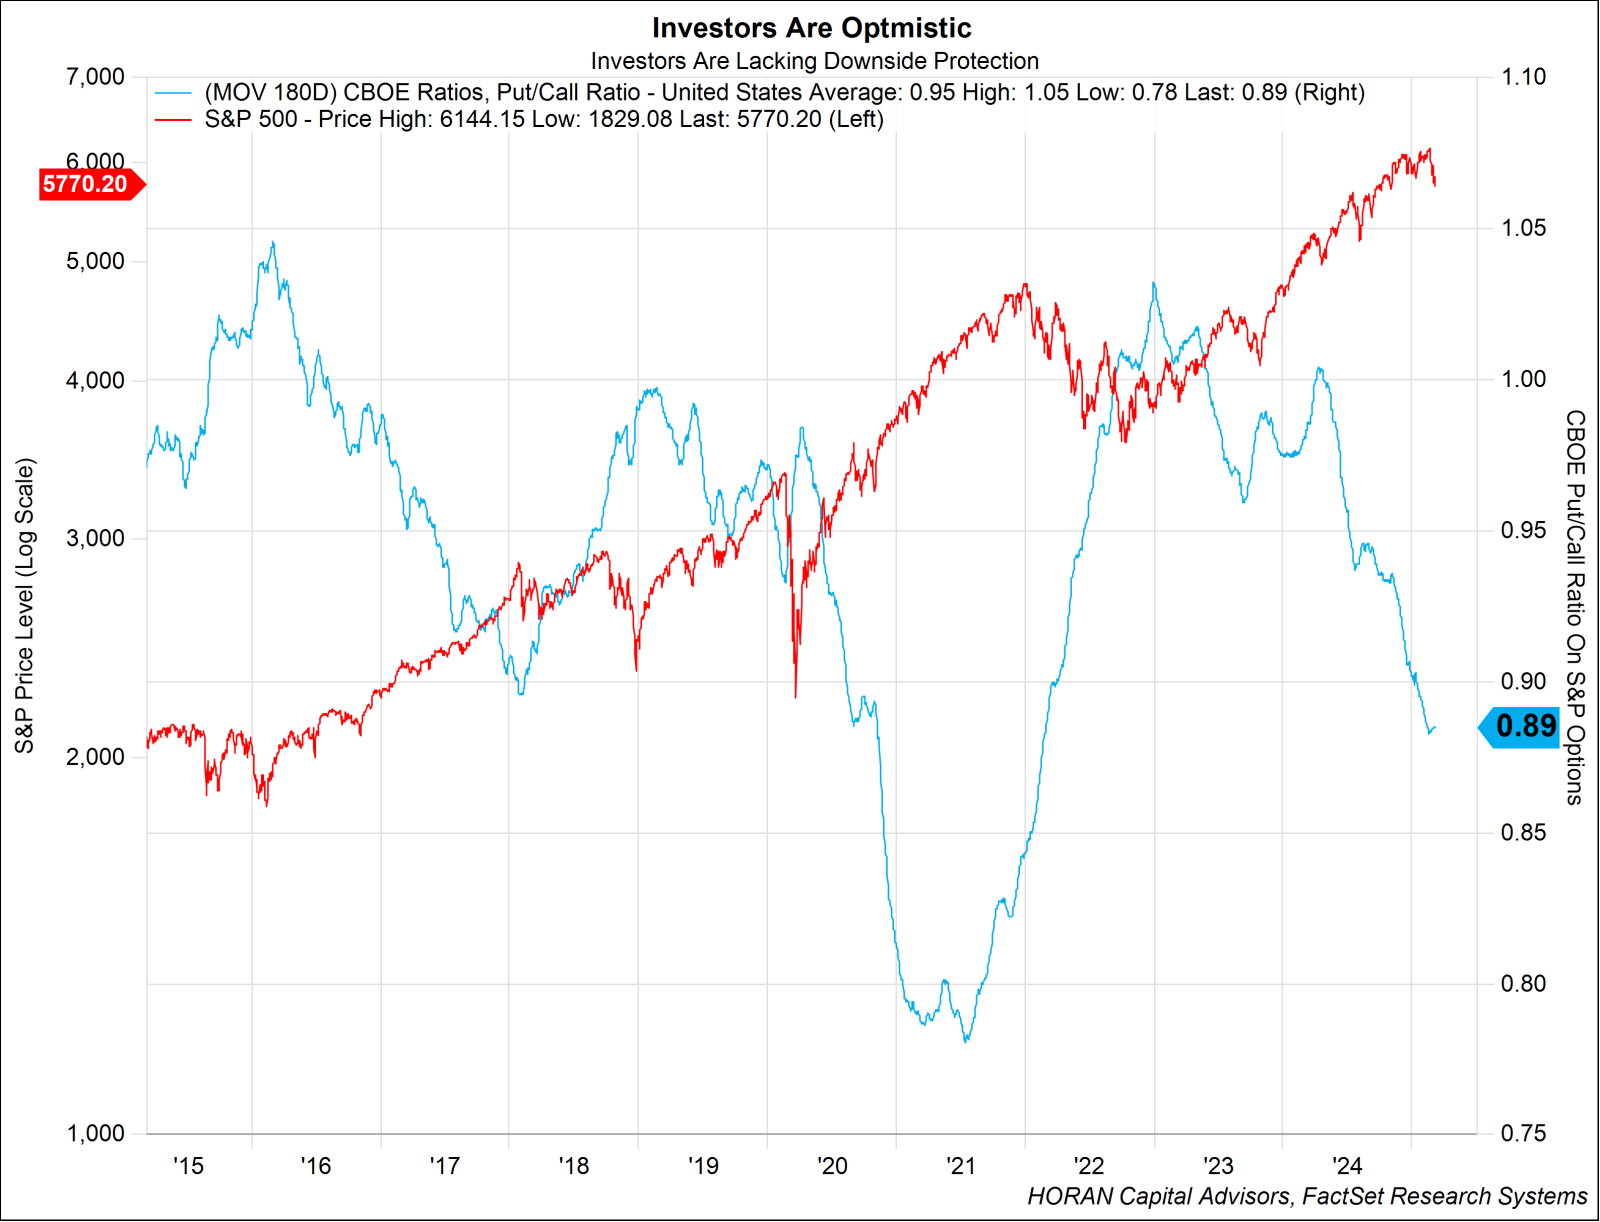
While intra-year corrections are common there may be several additional reasons to expect an increase in market volatility. The chart below highlights a potential relationship between investor sentiment and market returns. The blue line (right) is the 180-day moving average of the CBOE Put-to-Call ratio for option volume on the S&P 500 Index. The red line (left) is the S&P 500 price level (log scale). The relationship between these indicators is contrarian, as the blue line continues to fall investors become increasingly risk seeking evidenced by increasing call volume, a bullish behavior. ‘Risk-on’ trends can add to the market’s positive momentum. When the blue line increases, it is an indication that investors are hedging their equity exposure or minimizing portfolio risk since put volume is increasing. This risk-adverse behavior can pressure market returns lower or negative. In summary, the put/call ratio is a contrarian sentiment measure and at its extremes, the market tends to react contrary to investor positioning. In other words, at a high put/call ratio reading, a sign of high investor risk aversion, this would be one indication the market may be at an interim bottom. Likewise, a lower put/call ratio, indicating bullish behavior, could signal higher near-term volatility.
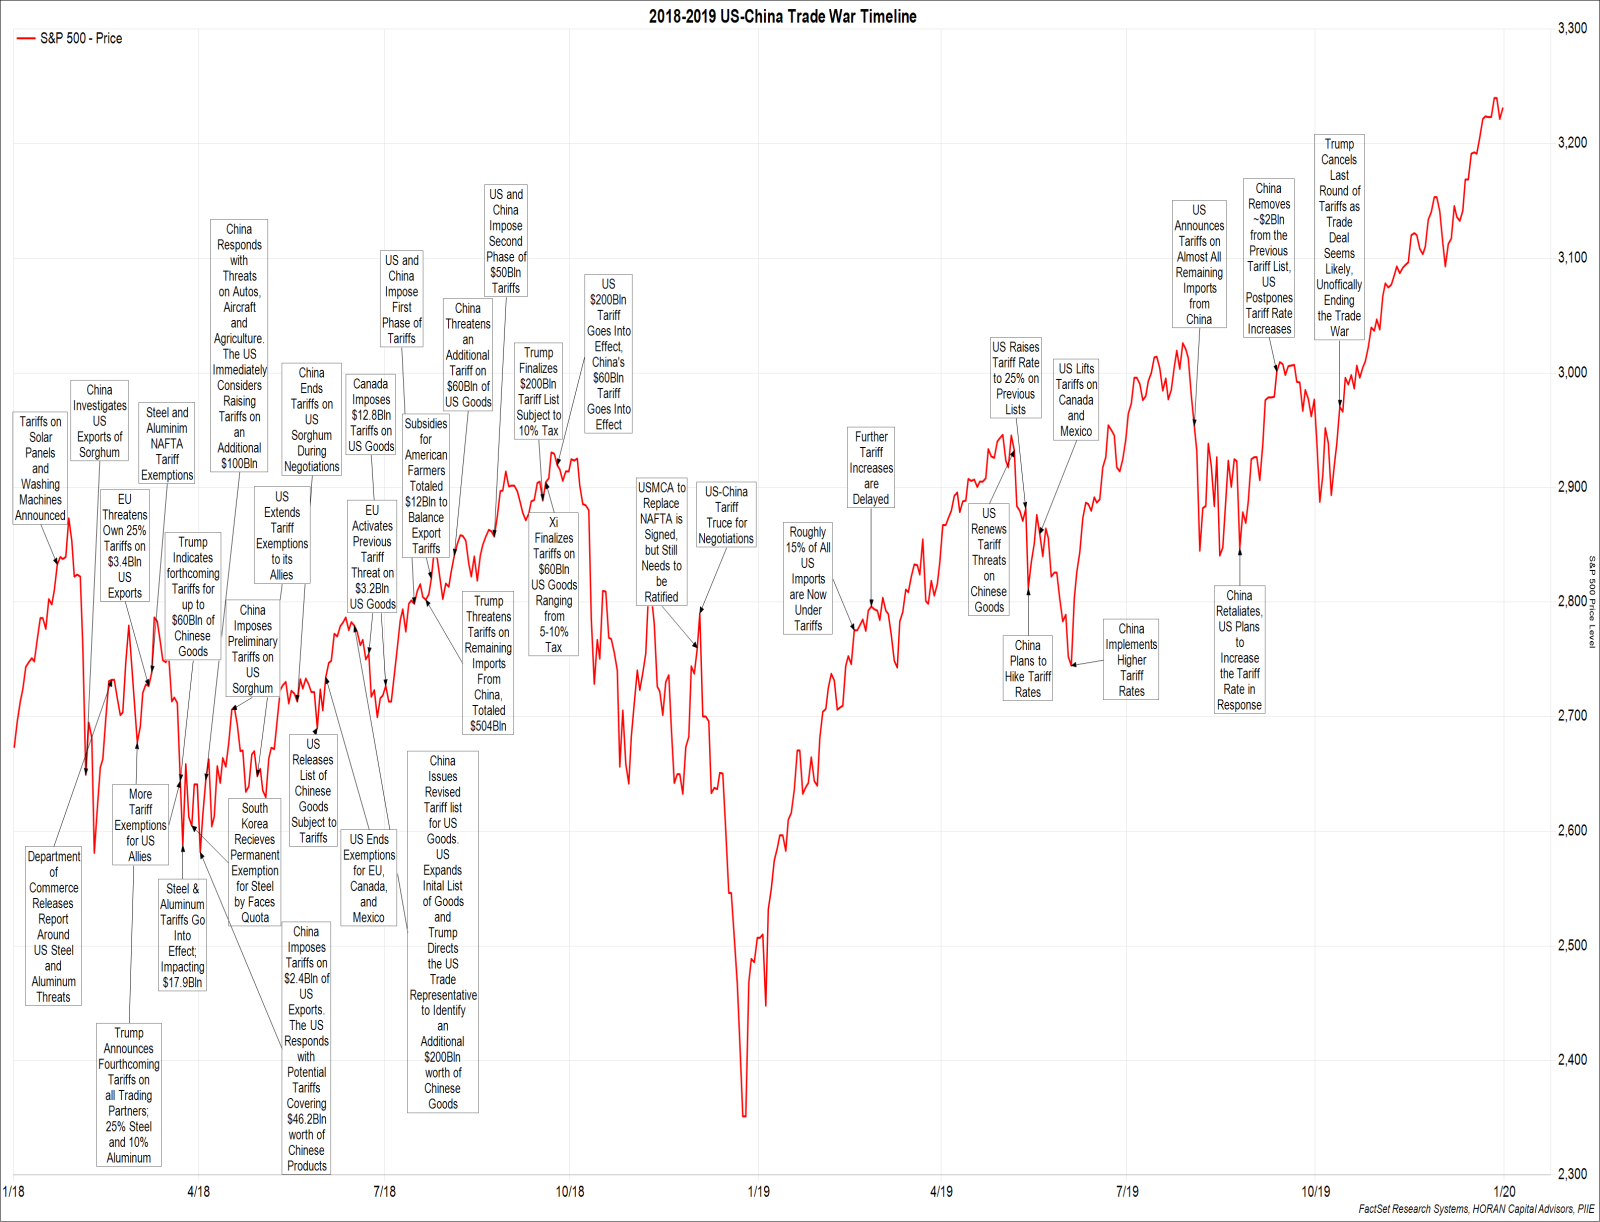
An additional recent occurrence heard in this news cycle has been tariffs. President Trump has announced a new wave of tariffs, which appears to have pressured the market. This is not the first time President Trump has used tariffs. Therefore, it’s important to review his first administration to see how markets reacted. Below is a timeline of the 2018-2019 trade war pared with the S&P 500 price level during that period. A common theme evidenced by the red line representing the S&P 500 Index is higher volatility, however, once the trade war was settled the market posted the 10th highest return for a calendar year since 1928.
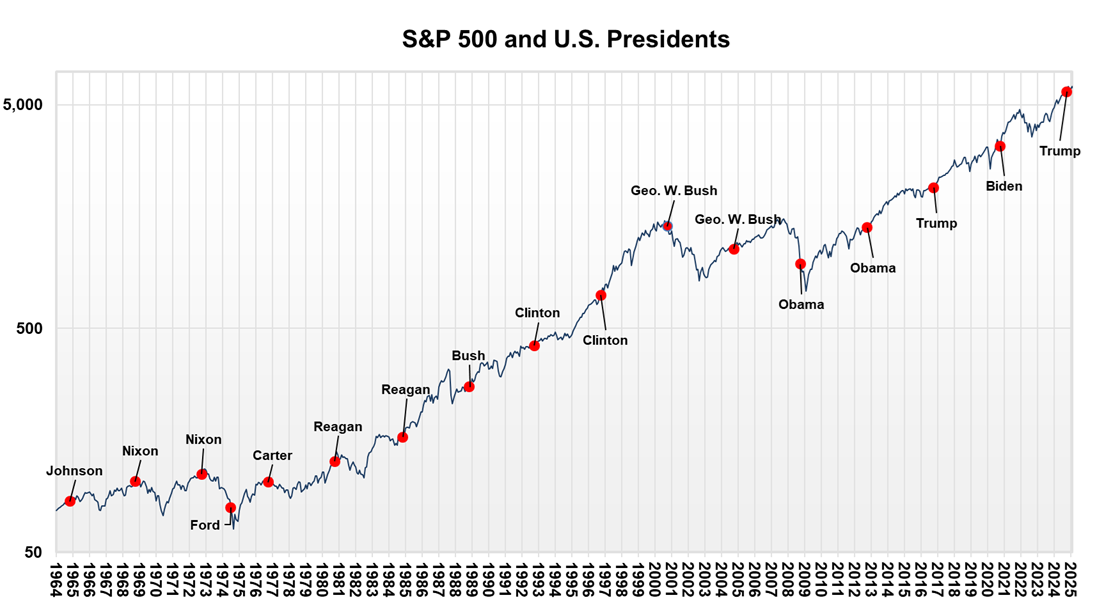
Lastly, in the long run, markets are agnostic to who sits in the White House. The chart below demonstrates this relationship. Including periods of high economic uncertainty, the Dotcom Bubble and the Great Financial Crisis, the S&P 500 has an annualized total return of 10.1%, since 1964. Additionally, investors who exited the market from 2017-2020 missed a cumulative total return of 81.5%, while investors who exited during 2021-2024 missed a cumulative total return of 66.4%. Investing can be emotional, especially when the market enters volatile periods. Therefore, its important to maintain a portfolio allocation that reflects the investor's risk tolerance while taking a step back to view the long-term trends.
HORAN Wealth, LLC is an SEC registered investment advisor. The information herein has been obtained from sources believed to be reliable, but we cannot assure its accuracy or completeness. Neither the information nor any opinion expressed constitutes a solicitation for the purchase or sale of any security. Any reference to past performance is not to be implied or construed as a guarantee of future results. Market conditions can vary widely over time and there is always the potential of losing money when investing in securities. HORAN Wealth and its affiliates do not provide tax, legal or accounting advice. This material has been prepared for informational purposes only, and is not intended to provide, and should not be relied on for tax, legal or accounting advice. You should consult your own tax, legal and accounting advisors before engaging in any transaction. For further information about HORAN Wealth, LLC, please see our Client Relationship Summary at adviserinfo.sec.gov/firm/summary/333974.